Math 14 HW 6.4.5-T Using the Central Limit Theorem
TLDRThe video transcript discusses a statistical problem involving the pulse rates of adult females, which are normally distributed with a mean of 72.0 beats per minute and a standard deviation of 12.5. The script guides through calculating the probability of an individual's pulse rate being less than 75 bpm using the z-score method. It further explains how to apply the central limit theorem for a sample of 16 females to find the probability of their mean pulse rate being less than 75 bpm. The video concludes with a clarification that the normal distribution can be used for sample means regardless of sample size due to the original population's normal distribution.
Takeaways
- 📊 The script discusses calculating probabilities based on a normally distributed population of female pulse rates, with a mean of 72.0 beats per minute and a standard deviation of 12.5 beats per minute.
- 📝 For part A, the process involves using the z-score formula to find the probability that a randomly selected adult female's pulse rate is less than 75 beats per minute.
- 📈 The z-score is calculated by subtracting the mean from the individual value and dividing by the standard deviation, resulting in a z-score of 0.24 for a pulse rate of 75.
- 🔍 A z-table or statistical software like StatCrunch is used to find the probability associated with the z-score, yielding a probability of 0.5948 for a pulse rate less than 75.
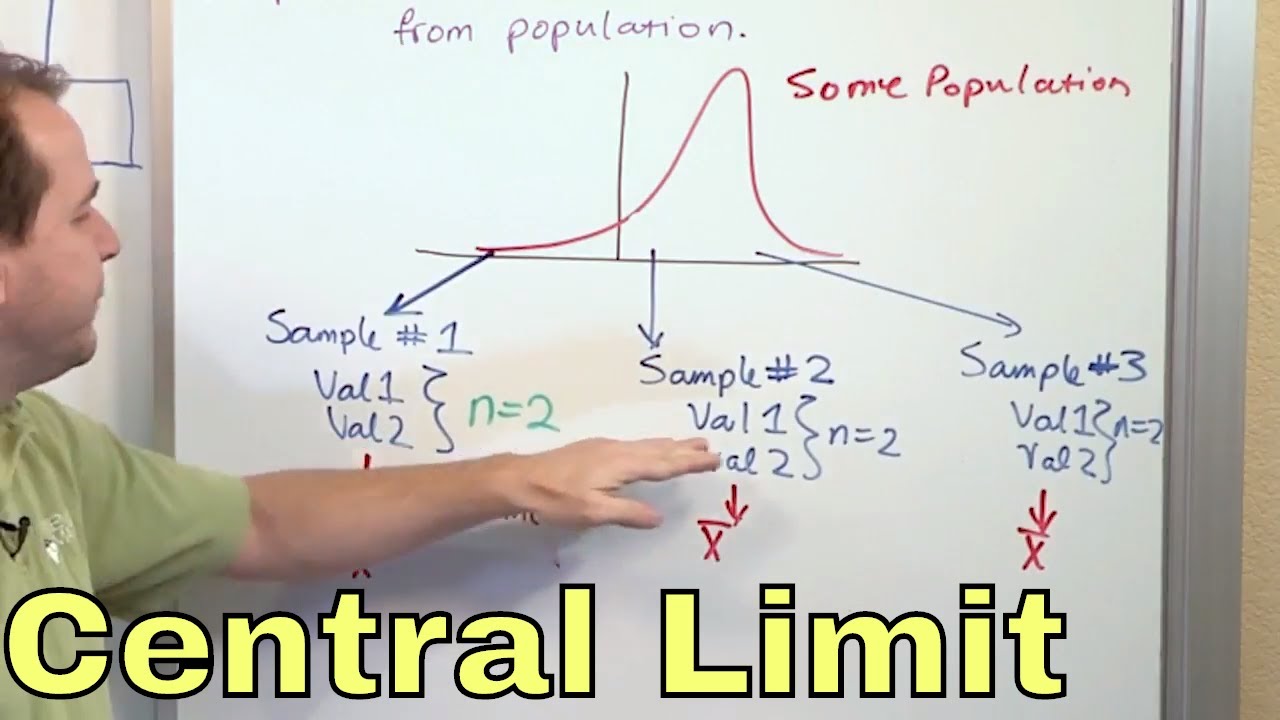
- 🌟 The Central Limit Theorem is introduced for part B, which states that the distribution of sample means approaches a normal distribution as the sample size increases, regardless of the original distribution.
- 🔢 In part B, the standard deviation of the sample mean is calculated as the population standard deviation divided by the square root of the sample size (n=16).
- 📉 For a sample of 16 adult females, the new z-score is calculated using the adjusted standard deviation, resulting in a z-score of 0.96 for a mean pulse rate of less than 75 beats per minute.
- 📊 Using StatCrunch again, the probability associated with the new z-score is found to be 0.8315, indicating the likelihood of the sample mean being less than 75.
- 🤔 The script also addresses a question about the applicability of the normal distribution in part B, even if the sample size does not exceed 30, clarifying that the distribution of sample means is normal for any sample size due to the Central Limit Theorem.
- 📚 The importance of understanding the difference between the distribution of individuals and the distribution of sample means is highlighted, as the latter is always normally distributed when applying the Central Limit Theorem.
Q & A
What is the mean pulse rate for adult females as mentioned in the script?
-The mean pulse rate for adult females is 72.0 beats per minute.
What is the standard deviation of pulse rates for adult females in the script?
-The standard deviation of pulse rates for adult females is 12.5 beats per minute.
What is the probability that a randomly selected adult female has a pulse rate less than 75 beats per minute?
-The probability is approximately 0.5948, which is the area under the normal distribution curve to the left of the z-score corresponding to 75 beats per minute.
How is the z-score calculated for a pulse rate of 75 beats per minute?
-The z-score is calculated as (75 - 72) / 12.5, which equals 0.24.
What statistical tool is used to find the probability associated with the z-score?
-StatCrunch is used to determine the probability associated with the z-score.
What is the central limit theorem and how does it apply to the second part of the script?
-The central limit theorem states that the distribution of sample means will be approximately normal for any sample size, provided the population distribution is normal or the sample size is greater than 30. It is used to find the probability of the mean pulse rate for a sample of 16 adult females being less than 75 beats per minute.
How is the standard deviation of the sample means calculated for a sample of 16 adult females?
-The standard deviation of the sample means is calculated as the population standard deviation (12.5) divided by the square root of the sample size (16), which gives 12.5 / 4 = 3.125.
What is the z-score for the mean pulse rate of a sample of 16 adult females if the mean is less than 75 beats per minute?
-The z-score is calculated as (75 - 72) / 3.125, which equals 0.96.
What is the probability that the mean pulse rate of a sample of 16 adult females is less than 75 beats per minute?
-The probability is approximately 0.8315, which is the area under the normal distribution curve to the left of the z-score corresponding to the sample mean of 75 beats per minute.
Can the normal distribution be used in part B of the script even though the sample size does not exceed 30?
-Yes, the normal distribution can be used because the original population has a normal distribution, and the central limit theorem applies to the distribution of sample means regardless of the sample size.
Outlines
📊 Calculating Individual Probability of Pulse Rate
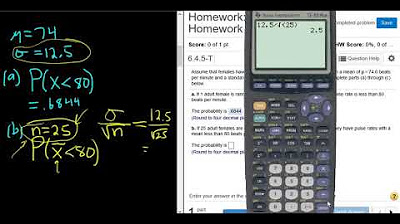
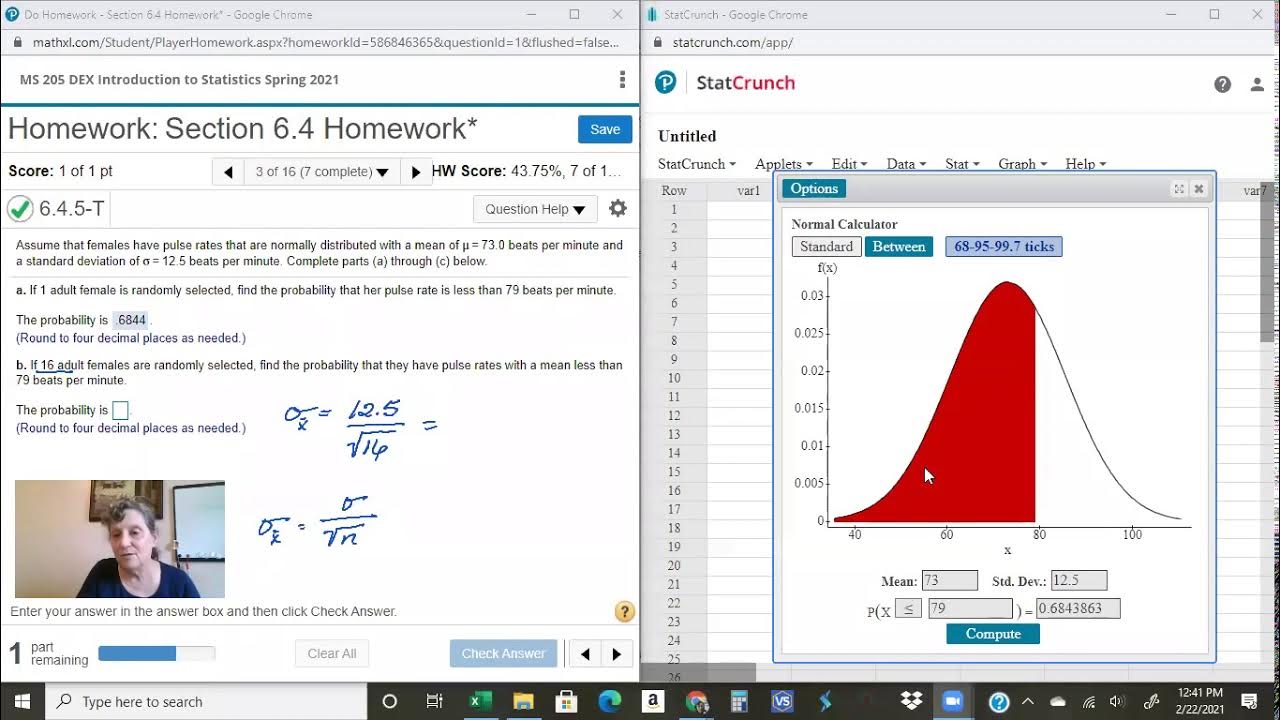
The first paragraph discusses the process of determining the probability that a randomly selected adult female has a pulse rate less than 75 beats per minute, given a normal distribution with a mean of 72.0 and a standard deviation of 12.5. The explanation involves drawing a bell curve, identifying the z-score for the individual value of 75, and using a calculator to find the probability associated with this z-score. The z-score is calculated as (75 - 72) / 12.5, resulting in 0.24. Using a statistical tool like StatCrunch, the probability of a pulse rate less than 75 is found to be approximately 0.5948.
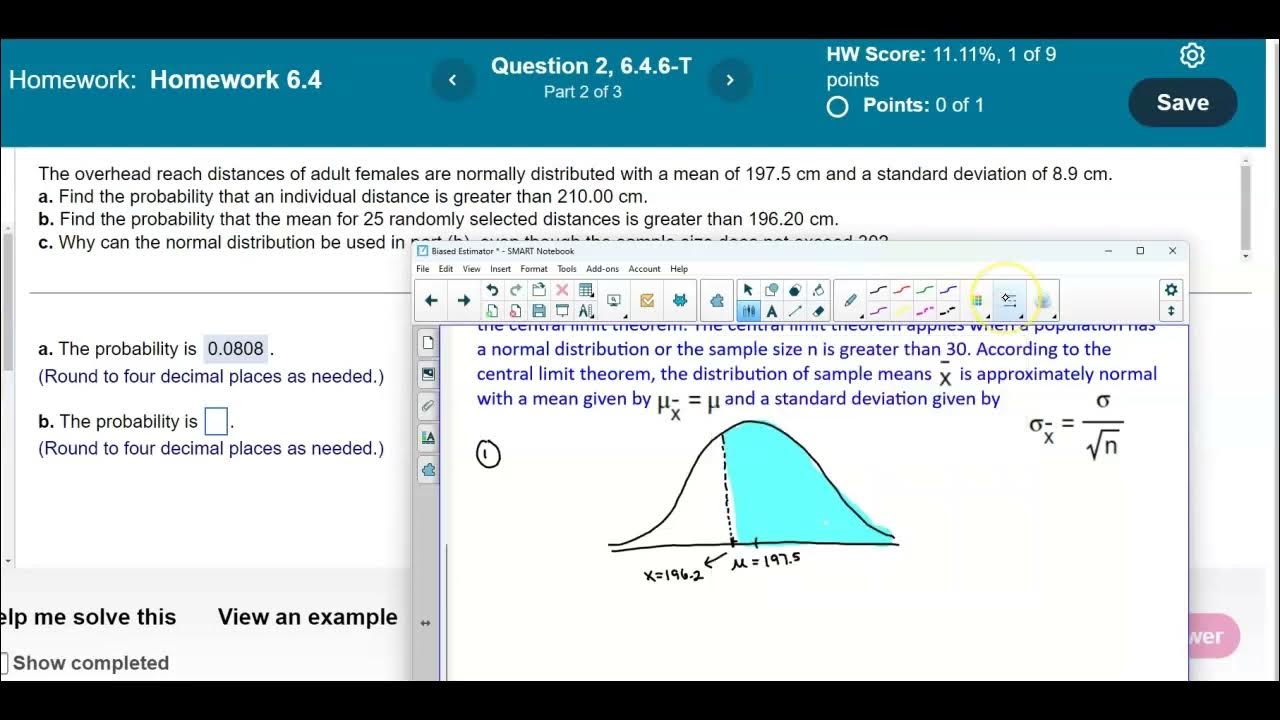
📚 Applying Central Limit Theorem to Sample Mean of Pulse Rates
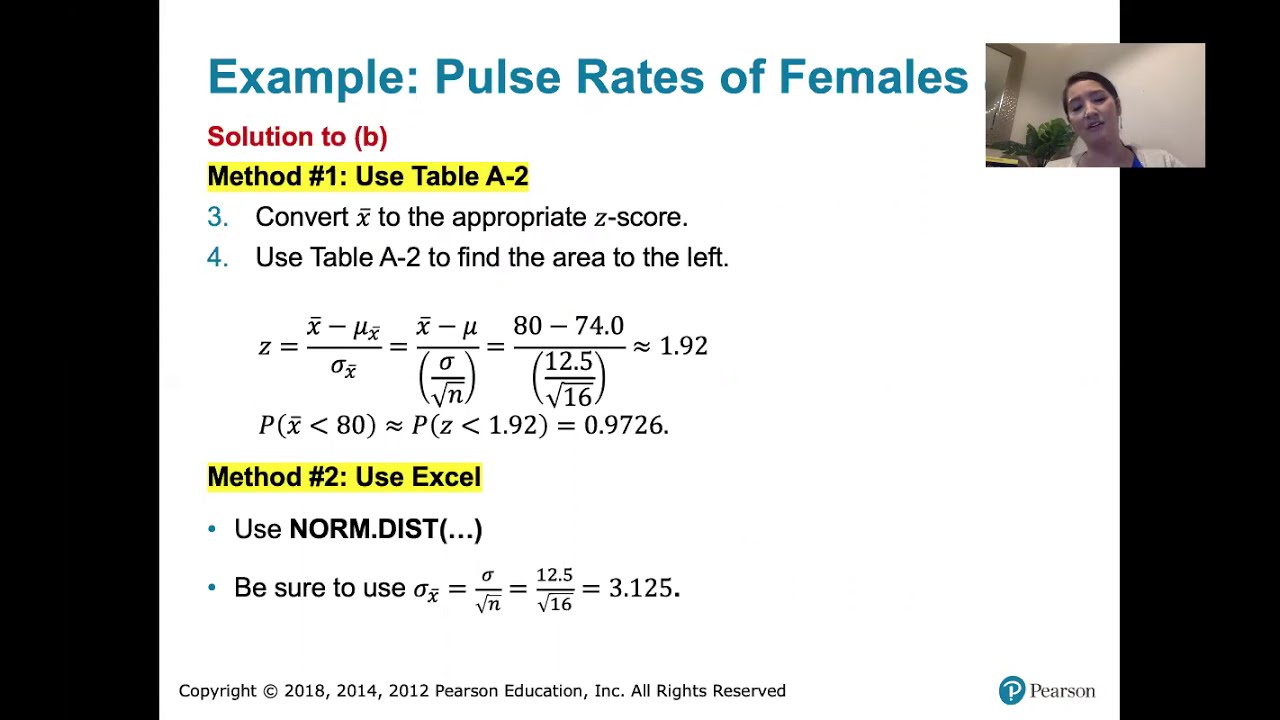
The second paragraph delves into the application of the Central Limit Theorem to find the probability that the mean pulse rate of a sample of 16 adult females is less than 75 beats per minute. The theorem is applicable due to the normal distribution of the original population or a sample size greater than 30. The distribution of sample means (X-bar) is approximately normal with a mean equal to the population mean and a standard deviation calculated as the population standard deviation divided by the square root of the sample size (n). The z-score for the sample mean is calculated using the formula (75 - 72) / (12.5 / √16), yielding a z-score of 0.96. Utilizing StatCrunch again, the probability that the sample mean is less than 75 is determined to be approximately 0.8315. The paragraph also addresses a question about the applicability of the normal distribution in this scenario, confirming that it can be used regardless of the sample size due to the normal distribution of the original population.
Mindmap
Keywords
💡Pulse Rate
💡Normal Distribution
💡Mean
💡Standard Deviation
💡Z-Score
💡Probability
💡Bell Curve
💡Central Limit Theorem
💡Sample Size
💡StatCrunch
Highlights
Assumption of normally distributed pulse rates for females with a mean of 72.0 beats per minute and a standard deviation of 12.5 beats per minute.
Introduction to finding the probability of an individual female's pulse rate being less than 75 beats per minute using the normal distribution.
Explanation of using the population distribution for an individual value from a normally distributed population.
Visual representation of the bell curve with mean and standard deviation for pulse rates.
Calculation of the z-score for a pulse rate of 75 beats per minute.
Use of StatCrunch to determine the probability associated with a z-score of 0.24.
Result of the probability calculation showing a 59.48% chance for an individual's pulse rate to be less than 75 beats per minute.
Transition to using the Central Limit Theorem for a sample of 16 adult females.
Application of the Central Limit Theorem for sample sizes greater than 30, even though the sample size in this case is 16.
Explanation of the distribution of sample means being approximately normal with the mean equal to the population mean and standard deviation adjusted by the square root of the sample size.
Re-calculation of the z-score for the sample mean of 75 beats per minute with a sample size of 16.
Determination of the new z-score as 0.96 for the sample mean scenario.
Utilization of StatCrunch again to find the probability for the sample mean scenario.
Probability result of 83.15% for the sample mean of pulse rates being less than 75 beats per minute.
Discussion on the applicability of the normal distribution in Part B despite the sample size not exceeding 30.
Clarification that the normal distribution can be used for the distribution of sample means regardless of the sample size due to the original population's normal distribution.
Transcripts
Browse More Related Video
Central Limit Theorem Probability Question with Pulse Rates in StatCrunch
Calculating Probabilities of Sample Distributions with StatCrunch
6.4.2 The Central Limit Theorem - Probabilities for a Range of Normally Distributed Sample Means
Math 14 HW 6.4.6-T Using the Central Limit Theorem
02 - What is the Central Limit Theorem in Statistics? - Part 1
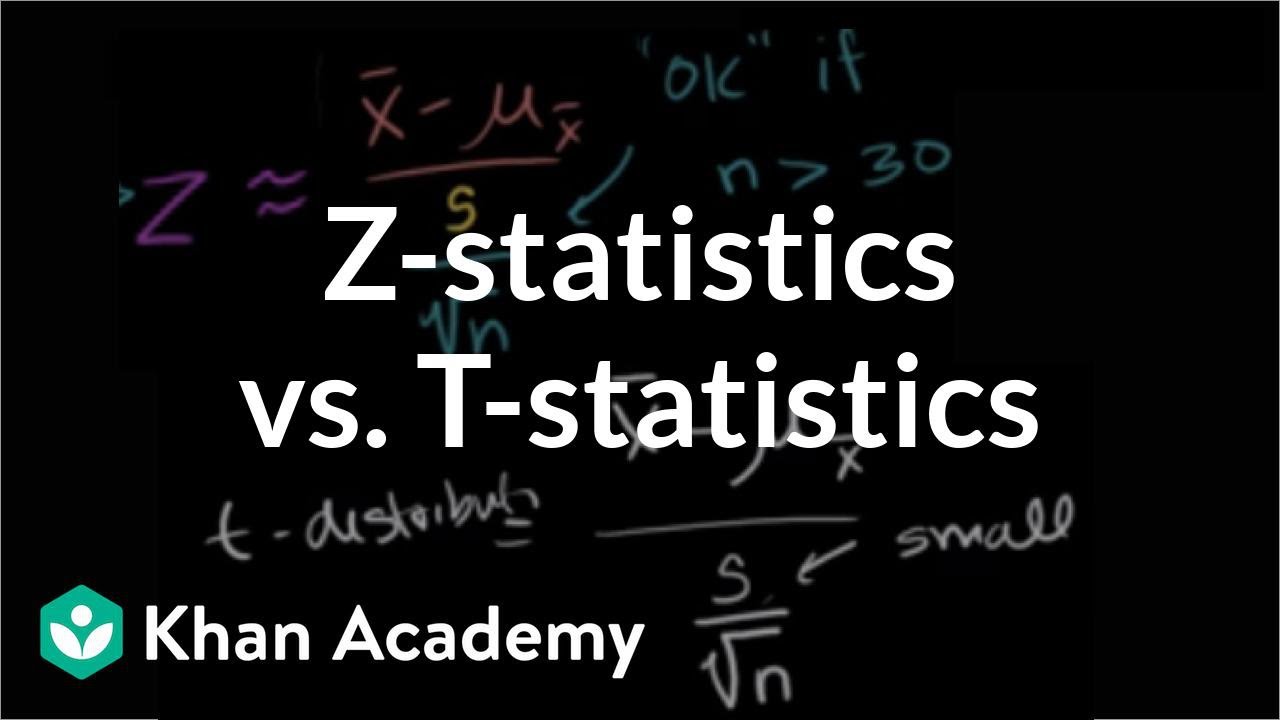
Z-statistics vs. T-statistics | Inferential statistics | Probability and Statistics | Khan Academy
5.0 / 5 (0 votes)
Thanks for rating: