Central Limit Theorem Probability Question with Pulse Rates in StatCrunch
TLDRThis video script explains a statistical problem involving the normal distribution of pulse rates among adult females. It guides through calculating the probability of a single female's pulse rate being under 80 bpm using a mean (μ) of 74 and a standard deviation (σ) of 12.5. For a sample of 25 females, it demonstrates how to adjust the standard deviation for the sample mean and calculate the probability of the mean pulse rate being less than 80 bpm, resulting in approximately 0.9918. The script also addresses the use of the normal distribution in such cases, clarifying that it's applicable due to the original population's normal distribution, not just because of the sample size.
Takeaways
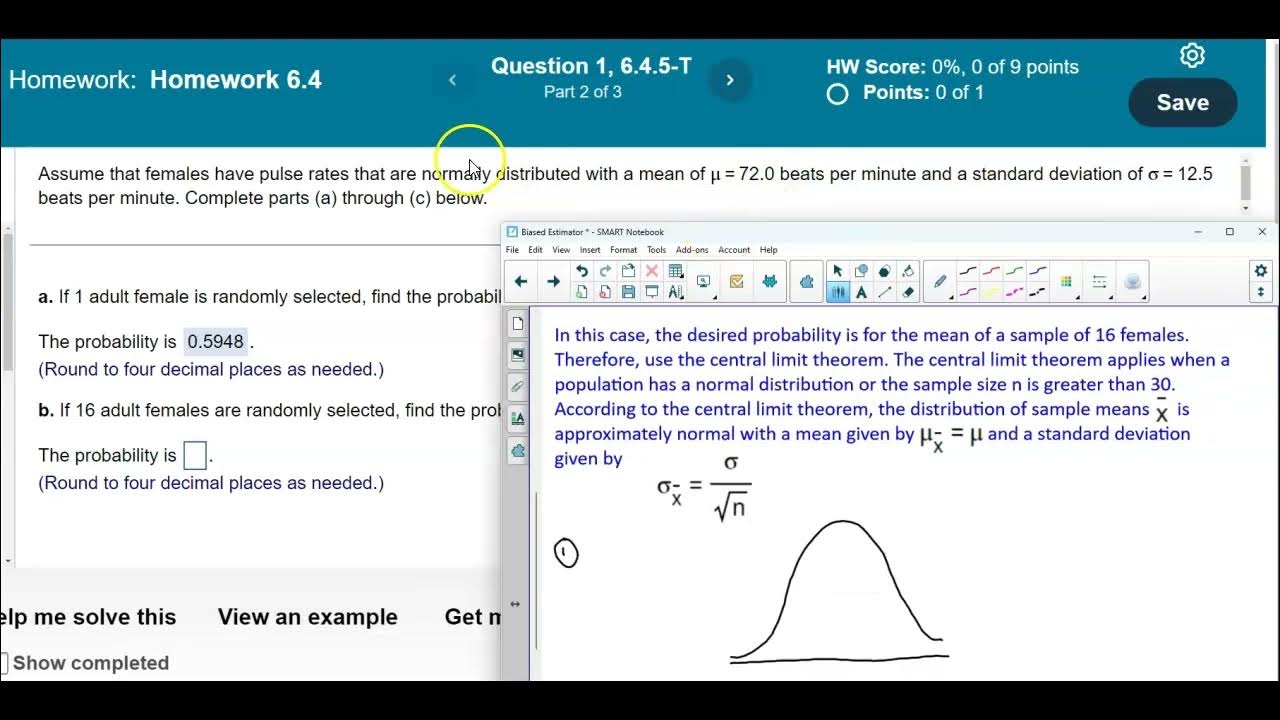
- 📊 The script discusses a statistical problem involving the pulse rates of adult females, which are assumed to be normally distributed with a mean (μ) of 74 beats per minute and a standard deviation (σ) of 12.5 beats per minute.
- 🔍 Part A of the problem asks for the probability that a randomly selected adult female has a pulse rate less than 80 beats per minute, using the normal distribution properties.
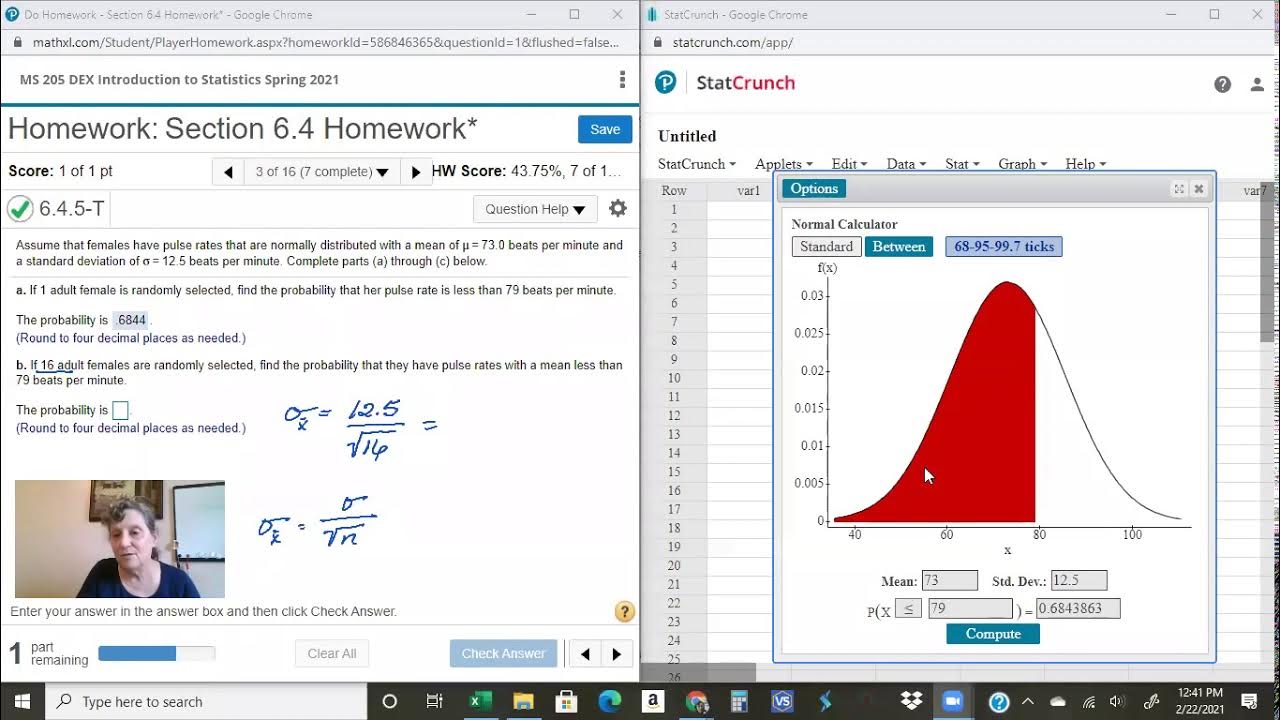
- 📝 The solution to Part A involves using a statistical software like StatCrunch to calculate the probability, which is found to be approximately 0.6844.
- 👩🔬 Part B shifts the focus to a sample of 25 adult females and asks for the probability that their average pulse rate is less than 80 beats per minute, not the individual rates.
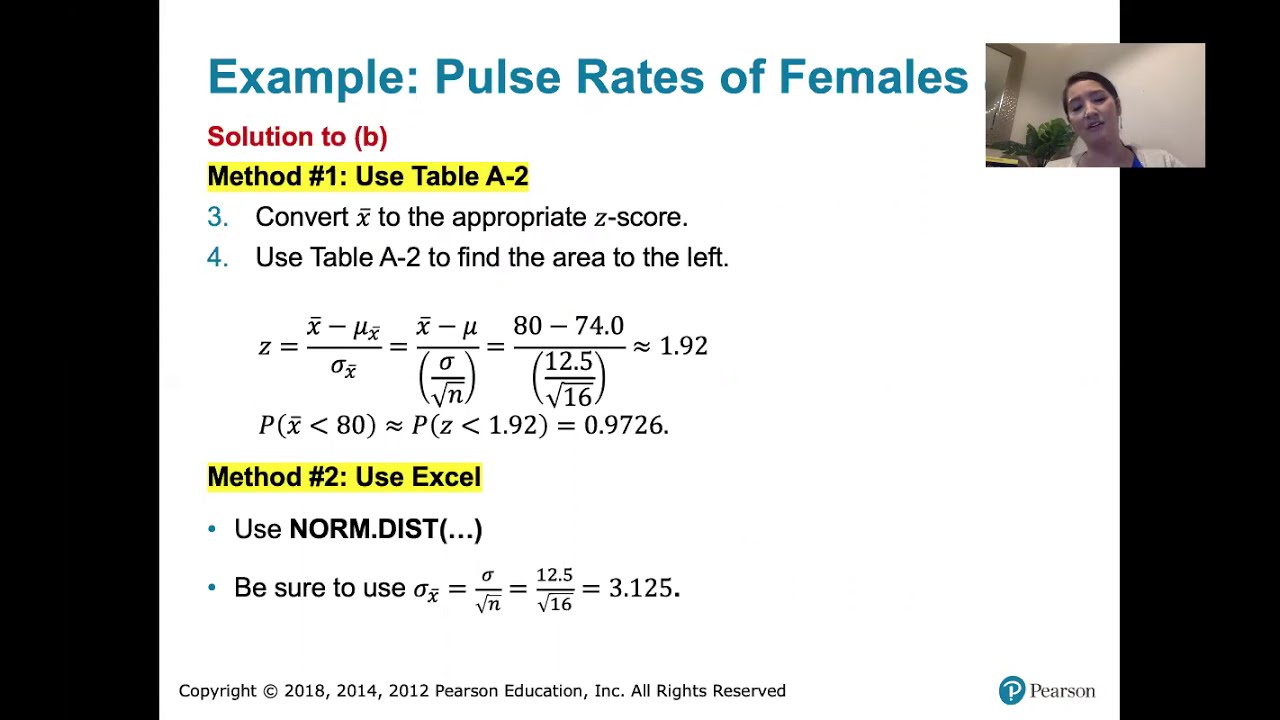
- 📐 For Part B, the standard deviation of the sample mean (σ/√n) is recalculated to account for the sample size, resulting in a new standard deviation of 2.5.
- 🔢 The recalculated standard deviation is then used in StatCrunch to find the probability concerning the sample mean, which is calculated to be approximately 0.9918.
- 🤔 A follow-up question in the script ponders why the normal distribution can be used in Part B even though the sample size does not exceed 30, a common rule of thumb for applying the central limit theorem.
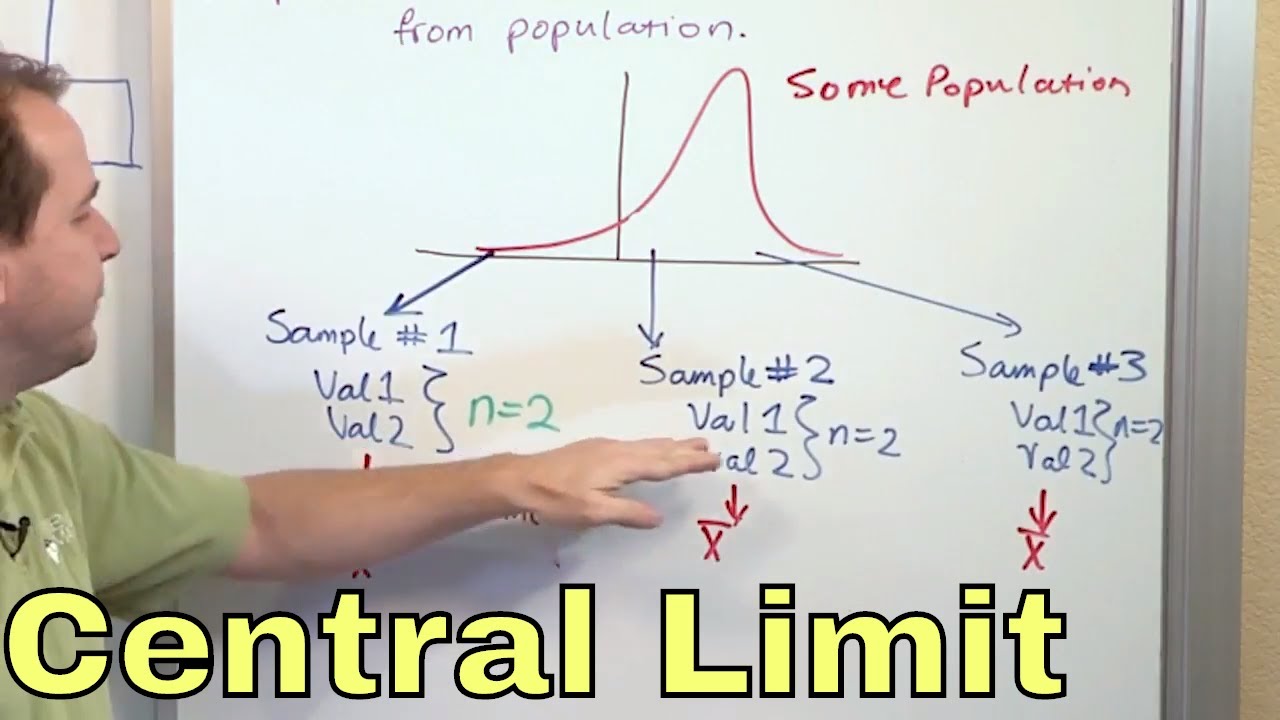
- 📚 The explanation provided is that the original population's pulse rates are normally distributed, and thus the distribution of sample means (x-bar) is also normal, regardless of the sample size.
- 📘 The central limit theorem is mentioned, which states that if the sample size is larger than 30, the sample mean (x-bar) is approximately normally distributed, but this is not a requirement for the problem at hand.
- 📌 The script emphasizes that when the original population is normal, the sample means are also normal, which justifies the use of the normal distribution in this statistical problem.
- 📝 The script provides a step-by-step guide on how to use StatCrunch for these types of normal distribution problems, including how to input the mean, standard deviation, and the value for which the probability is sought.
Q & A
What is the mean pulse rate for adult females according to the script?
-The mean pulse rate for adult females is given as 74 beats per minute.
What is the standard deviation of the pulse rates mentioned in the script?
-The standard deviation of the pulse rates is 12.5 beats per minute.
What is the probability that a randomly selected adult female has a pulse rate less than 80 beats per minute?
-The probability that a randomly selected adult female has a pulse rate less than 80 beats per minute is approximately 0.6844.
What statistical tool is used in the script to find the probability of pulse rates?
-The script uses StatCrunch to calculate the probability of pulse rates.
How does the script handle the case where the sample size is greater than one?
-When the sample size is greater than one, the script calculates a new standard deviation by dividing the original standard deviation by the square root of the sample size.
What is the new standard deviation used in the script when 25 adult females are selected?
-The new standard deviation used when 25 adult females are selected is 2.5 beats per minute.
What is the probability that the mean pulse rate of 25 randomly selected adult females is less than 80 beats per minute?
-The probability that the mean pulse rate of 25 randomly selected adult females is less than 80 beats per minute is approximately 0.9918.
Why can the normal distribution be used in Part B of the script, even though the sample size does not exceed 30?
-The normal distribution can be used in Part B because the original population of pulse rates is normally distributed. The central limit theorem states that the distribution of sample means is approximately normal if the sample size is greater than 30, but in this case, the population is already normal, so the sample means are also normal.
What is the central limit theorem mentioned in the script?
-The central limit theorem states that if the sample size is greater than 30, the distribution of sample means is approximately normal, regardless of the population distribution.
How does the script determine whether to use the normal distribution for sample means?
-The script determines the use of the normal distribution for sample means based on two conditions: either the original population is normally distributed, or the sample size is greater than 30, which invokes the central limit theorem.
What is the significance of the sample size in the context of the script?
-The sample size is significant because it affects the standard deviation used in the normal distribution calculations. A larger sample size (greater than 30) can invoke the central limit theorem, making the distribution of sample means approximately normal.
Outlines
📊 Calculating Probability of Pulse Rates in Adults
This paragraph discusses a statistical problem involving the pulse rates of adult females, which are assumed to be normally distributed with a mean (μ) of 74 beats per minute and a standard deviation (σ) of 12.5 beats per minute. The task is to find the probability that a randomly selected adult female has a pulse rate less than 80 beats per minute using a statistical software called StatCrunch. The process involves inputting the mean and standard deviation into the software and computing the probability, which is found to be approximately 0.6844.
🔍 Probability of Average Pulse Rates in a Sample
The second paragraph extends the statistical analysis to a sample of 25 adult females, aiming to find the probability that their average pulse rate is less than 80 beats per minute. The solution requires adjusting the standard deviation for the sample mean by dividing the original standard deviation (σ) by the square root of the sample size (n), which is 25 in this case. The new standard deviation is then used in StatCrunch to calculate the probability, resulting in approximately 0.9918. The paragraph also addresses a follow-up question regarding the use of the normal distribution for the sample mean despite the sample size not exceeding 30, explaining that the normal distribution can be used because the original population of pulse rates is normally distributed, not because of the central limit theorem.
Mindmap
Keywords
💡Pulse Rate
💡Normal Distribution
💡Mean (mu)
💡Standard Deviation (sigma)
💡Probability
💡StatCrunch
💡Sample Mean (X bar)
💡Sample Size (n)
💡Central Limit Theorem (CLT)
💡Statistical Calculator
💡Sample Standard Deviation
Highlights
Assumption of normally distributed female pulse rates with a mean (mu) of 74 beats per minute and a standard deviation (sigma) of 12.5 beats per minute.
Introduction to Part A of the problem, which involves finding the probability of a single adult female's pulse rate being less than 80 beats per minute.
Use of StatCrunch software for calculating probabilities in normal distribution scenarios.
Explanation of selecting 'less than' in the normal distribution calculator as equivalent to 'less than or equal to'.
Calculation result of 0.6844 as the probability for Part A, rounded to four decimal places.
Transition to Part B, focusing on the probability of the mean pulse rate of 25 randomly selected adult females being less than 80 beats per minute.
Concept of sample mean (X bar) and its relation to the sample size (n) in statistical analysis.
Adjustment of the standard deviation for sample means using the formula sigma over the square root of n.
Calculation of the new standard deviation for Part B as 2.5.
Re-entry into StatCrunch with updated parameters for the sample mean's standard deviation.
Result of 0.9918 for the probability in Part B, indicating a very high likelihood of the sample mean being less than 80.
Discussion on the applicability of the normal distribution in Part B despite the sample size not exceeding 30.
Clarification that the central limit theorem applies one way: if n is greater than 30, then X bar is approximately normal.
Explanation that the original population's normal distribution justifies the use of the normal distribution for sample means in this problem.
Differentiation between the central limit theorem and the given normal distribution of the population in the problem statement.
Emphasis on the importance of the original population's distribution in determining the distribution of sample means.
Transcripts
Browse More Related Video
Math 14 HW 6.4.5-T Using the Central Limit Theorem
Calculating Probabilities of Sample Distributions with StatCrunch
6.4.2 The Central Limit Theorem - Probabilities for a Range of Normally Distributed Sample Means

The Probability an Elevator is Overloaded Central Limit Theorem with StatCrunch
02 - What is the Central Limit Theorem in Statistics? - Part 1
6.4.1 The Central Limit Theorem - What the Central Limit Theorem Says and What It Doesn't Say
5.0 / 5 (0 votes)
Thanks for rating: