How to find the mean, median, mode, standard deviation and variance.
TLDRThe video script provides a detailed walkthrough of calculating statistical measures for a given dataset: 24, 31, 12, 38, 12, 15, 12, 28, 16, and 32. The presenter explains how to find the mean (22), median (20), mode (12), and standard deviation (9.79) of the data. The process involves arranging the data, calculating differences from the mean, squaring these differences, and using them to compute the standard deviation and variance. The explanation is methodical, making it accessible for viewers to understand basic statistical analysis.
Takeaways
- 📊 The script discusses statistical calculations for a given dataset: 24, 31, 12, 38, 12, 15, 12, 28, 16, and 32.
- 🧮 The mean (average) of the dataset is calculated to be 22 by summing all data points and dividing by the number of data points, which is 10.
- 🔢 The median is determined to be 20 after arranging the data in ascending order and averaging the two middle numbers, 16 and 24, for this even-numbered dataset.
- 📈 The mode, the most frequently occurring number in the dataset, is identified as 12, which appears three times.
- 📚 The standard deviation is calculated using the formula for a sample, involving squaring the difference between each data point and the mean, summing these squares, and taking the square root of the result over n-1.
- ➗ The variance is the square of the standard deviation, which is approximately 95.8 in this case.
- 📝 The process involves creating a column for the difference between each data point and the mean, and another for the square of these differences.
- 𑁍 The sum of the squared differences is calculated to be 862 before taking the square root to find the standard deviation.
- 🔍 The script emphasizes the importance of arranging the data in ascending order before finding the median.
- 📉 The calculation of the standard deviation is detailed, showing each step from squaring the differences to finding the square root of the sum.
- 📋 The script provides a step-by-step guide to finding the mean, median, mode, variance, and standard deviation of a dataset.
Q & A
What is the dataset provided in the script?
-The dataset provided in the script is 24, 31, 12, 38, 12, 15, 12, 28, 16, and 32.
What is the mean of the dataset calculated in the script?
-The mean of the dataset is calculated to be 22.
How is the median of the dataset determined in the script?
-The median is determined by first arranging the data in ascending order and then finding the middle value. Since there are an even number of data points, the median is the average of the two middle numbers, which are 16 and 24, resulting in a median of 20.
What is the mode of the dataset according to the script?
-The mode of the dataset is 12, as it appears three times, which is more frequent than any other number in the dataset.
What is the process for finding the standard deviation as described in the script?
-The process involves calculating the difference between each data point and the mean (x - x̄), squaring these differences, summing them up, and then taking the square root of the sum divided by the number of data points minus one (862 / 9), which gives the standard deviation as approximately 9.79.
What is the variance, and how is it related to the standard deviation in the script?
-The variance is the square of the standard deviation. In the script, it is calculated by squaring the standard deviation (9.79 * 9.79), resulting in a variance of approximately 95.8.
Why is the data set rearranged in ascending order before finding the median?
-The data set is rearranged in ascending order to easily identify the middle value(s), which is necessary for determining the median in an ordered list.
What is the significance of the number of data points (n) in calculating the mean and standard deviation?
-The number of data points (n) is crucial as it determines the divisor in the calculation of the mean (n) and the degrees of freedom in the standard deviation calculation (n - 1).
How does the script handle the calculation of the mean when there are repeated data points?
-The script treats repeated data points the same as unique ones, summing all values and then dividing by the total count of data points, regardless of repetition.
What is the role of the 'x̄' symbol in the script?
-The 'x̄' symbol represents the mean of the dataset. It is used as a reference point for calculating the differences (x - x̄) that are squared for the standard deviation calculation.
Outlines
📊 Calculating Descriptive Statistics
The first paragraph discusses the process of calculating the mean, median, mode, and standard deviation from a given data set: 24, 31, 12, 38, 12, 15, 12, 28, 16, and 32. The mean is calculated by summing all data points and dividing by the number of points, resulting in 22. The median is found by arranging the data in ascending order and averaging the two middle numbers, which are 16 and 24, yielding a median of 20. The mode, the most frequently occurring number, is identified as 12, occurring three times. The explanation sets the stage for further statistical analysis.
📈 Standard Deviation Calculation
The second paragraph delves into the calculation of the standard deviation. The data set is rearranged in ascending order, and the difference between each data point and the mean (22) is determined, then squared. These squared differences are summed and divided by the number of data points minus one (9), resulting in a sum of 862. The square root of this sum gives an approximate standard deviation of 9.79. This step is crucial for understanding the dispersion of the data set around the mean.
📉 Variance and Final Calculations
The final paragraph concludes the statistical analysis by discussing the variance, which is the square of the standard deviation. The variance is calculated by squaring the standard deviation (9.79), resulting in approximately 95.77. This value provides insight into the spread of the data, indicating how much the data points deviate from the mean on average. The paragraph wraps up the detailed explanation of the statistical measures derived from the given data set.
Mindmap
Keywords
💡Statistics
💡Data Set
💡Mean
💡Median
💡Mode
💡Standard Deviation
💡Variance
💡Data Points
💡Ascending Order
💡Calculation
💡Contextualization
Highlights
Introduction to the problem of calculating statistical measures for a given dataset.
Explanation of the dataset provided: a list of 10 numbers.
Definition of the term 'data x' for the given dataset.
Instruction to find mean, median, mode, and standard deviation of the dataset.
Calculation of the mean by summing all data points and dividing by the number of data points.
Summation of the dataset's values to find the total sum for mean calculation.
Division of the total sum by the number of data points (10) to find the mean, which is 22.
Process of finding the median by arranging the data in ascending order.
Explanation of calculating the median for an even number of data points.
Median calculation resulting in the value of 20.
Identification of the mode as the most frequently occurring number in the dataset.
Determination of the mode as the number 12, occurring three times in the dataset.
Introduction to the process of calculating the standard deviation.
Explanation of the formula for standard deviation and the need to square the differences.
Calculation of squared differences from the mean for each data point.
Summation of the squared differences to find the total for standard deviation calculation.
Application of the standard deviation formula using the sum of squared differences and the number of data points minus one.
Final calculation of the standard deviation, resulting in a value of 9.79.
Explanation of variance as the square of the standard deviation.
Calculation of variance, resulting in a value of 95.8 after rounding.
Transcripts
Browse More Related Video
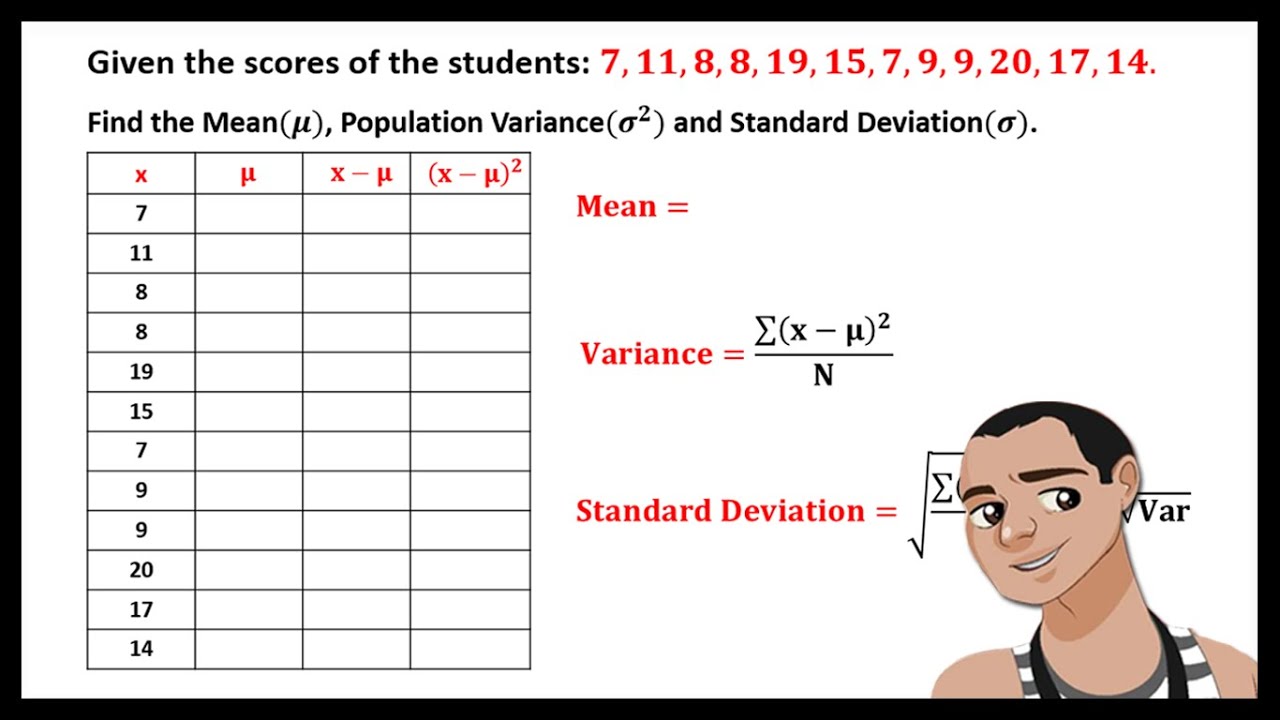
MEAN, VARIANCE, AND STANDARD DEVIATION FOR UNGROUPED DATA
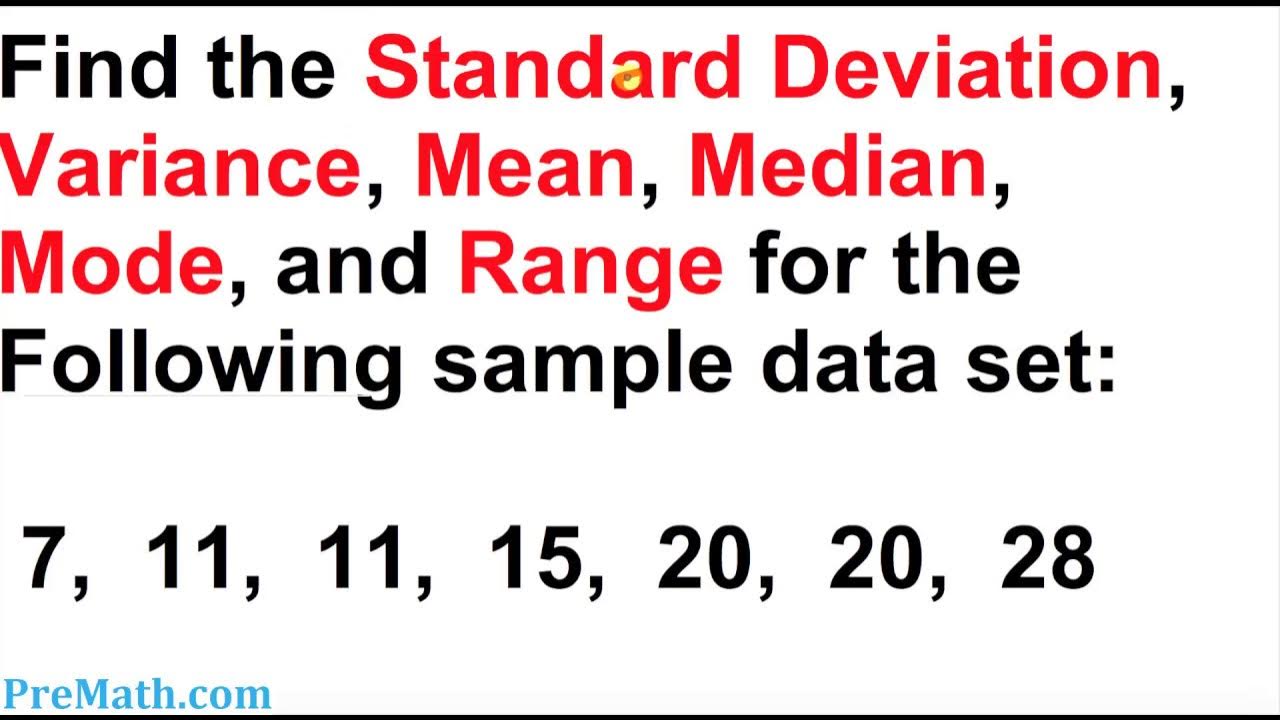
How to Find the Standard Deviation, Variance, Mean, Mode, and Range for any Data Set
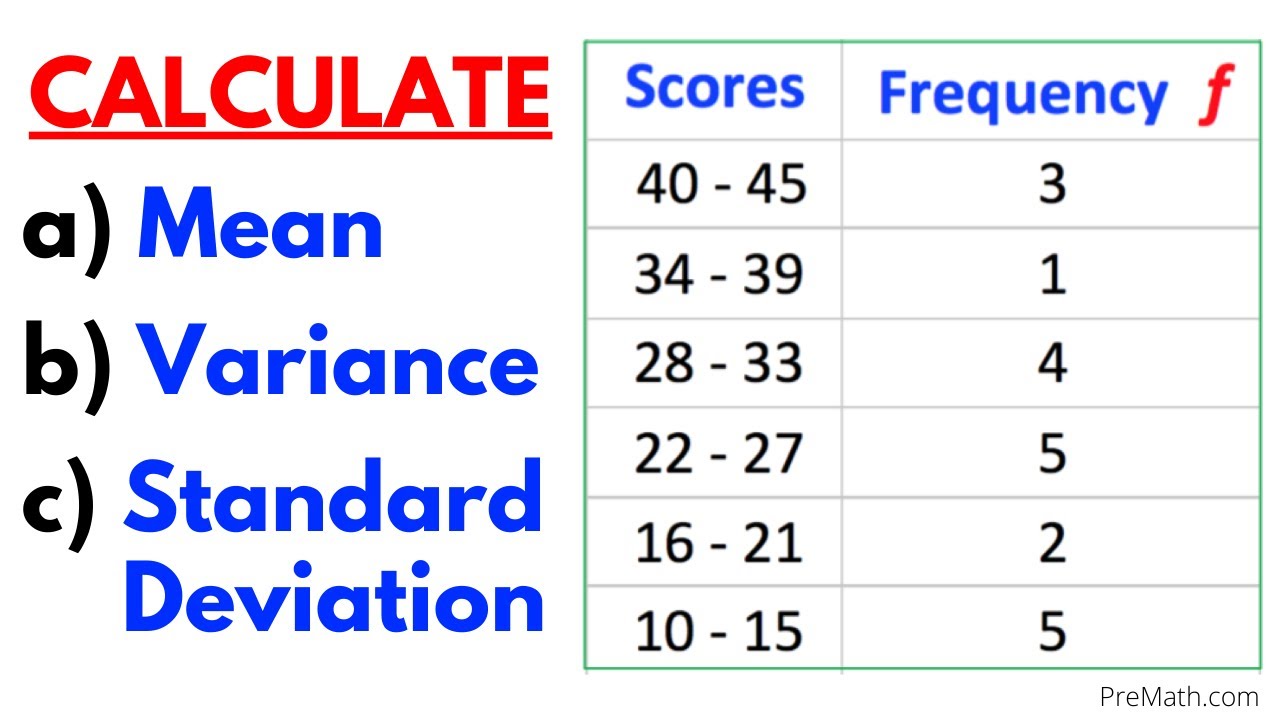
Find the Mean, Variance, & Standard Deviation of Frequency Grouped Data Table| Step-by-Step Tutorial
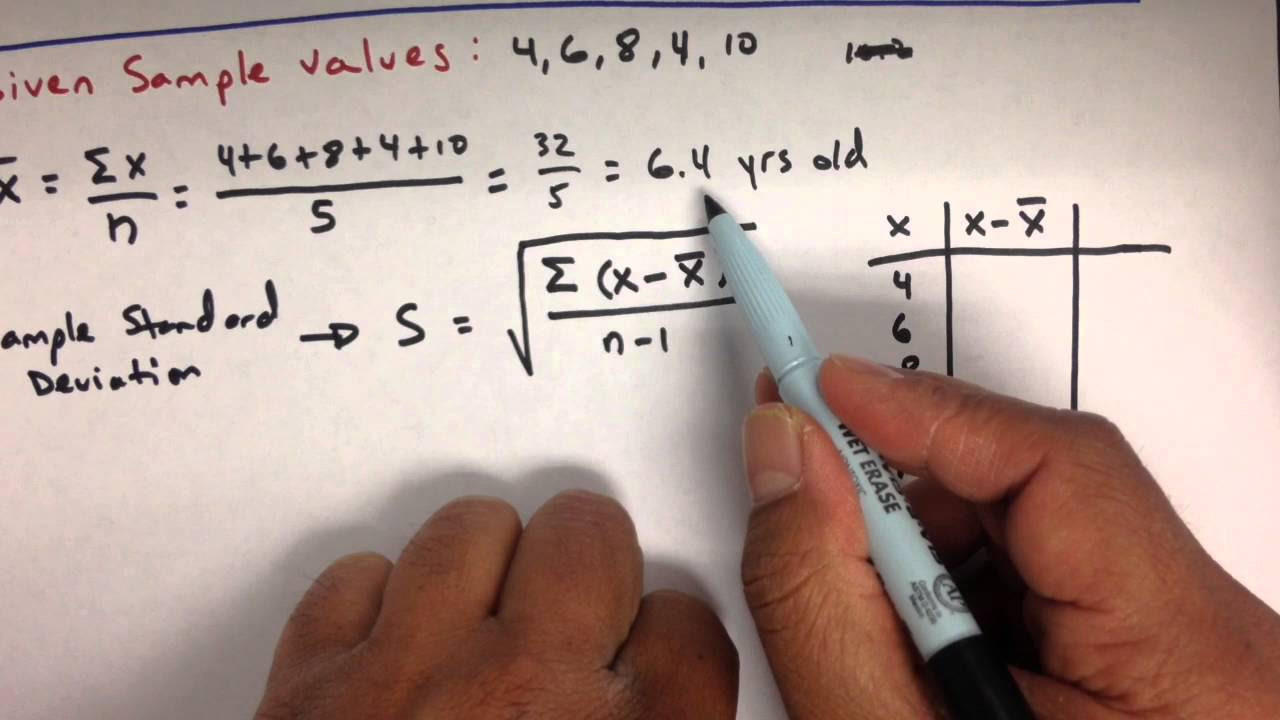
Variance and Standard Deviation: Sample and Population Practice Statistics Problems

Statistics: Standard deviation | Descriptive statistics | Probability and Statistics | Khan Academy

How to Calculate Standard Deviation
5.0 / 5 (0 votes)
Thanks for rating: