How to Find the Standard Deviation, Variance, Mean, Mode, and Range for any Data Set
TLDRThis instructional video presents a clear and straightforward method for calculating key statistical measures from a given dataset. It explains how to find the median, mode, range, mean, variance, and standard deviation, emphasizing the importance of organizing data and applying specific formulas. The video demonstrates each step with examples, ensuring viewers understand the process and can apply these statistical concepts to their own data analysis.
Takeaways
- 📊 Arrange data in ascending order to begin the analysis.
- 🔢 The median is the middle number in a sorted list of numbers.
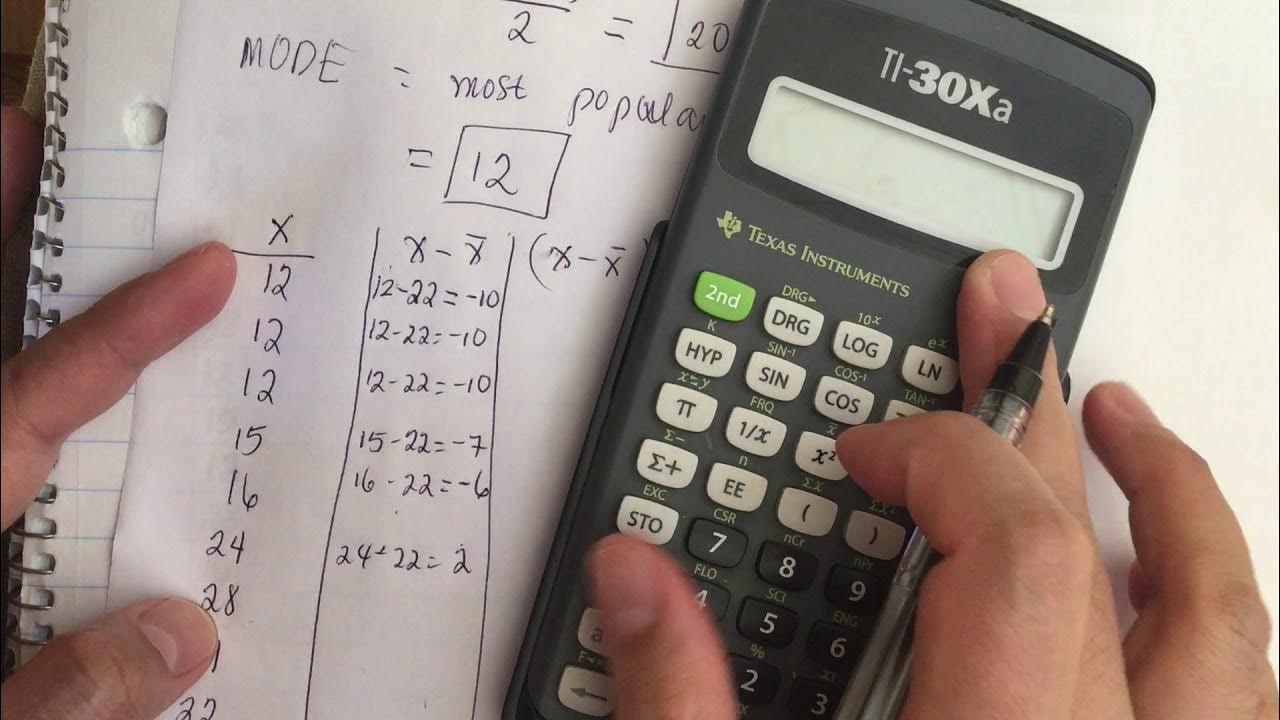
- 🏷️ The mode is the number that appears most frequently in a data set.
- 🌟 This data set has two modes, 11 and 20, each appearing twice.
- 📈 The range is the difference between the highest and lowest values in the data set.
- 📝 The mean (x̄) is calculated by summing all data values and dividing by the number of values.
- 🔢 To find the variance (s²), use the formula s² = Σ(x - x̄)² / (n - 1).
- 📊 Subtract the mean from each data value to find the deviations (x - x̄).
- 🔢 Square each deviation and sum them up to use in the variance calculation.
- 🚀 The standard deviation (s) is the square root of the variance.
- 🔍 For an even number of data points, the median is the average of the two middle numbers.
Q & A
What is the first step in organizing the given data for analysis?
-The first step is to rearrange the given data from lowest to highest order, meaning in an ascending order.
How is the median defined and what is the median in the given example?
-The median is defined as the middle number in a dataset. In the given example, the median is 15, as it has three values on both the left and right sides.
What are the modes in the provided dataset and how are they determined?
-The modes are the numbers that appear most frequently in the dataset. In this case, 11 and 20 are the modes because they each appear twice.
How is the range calculated and what is the range for the given data?
-The range is calculated by subtracting the smallest value from the largest value in the dataset. For the given data, the range is 28 minus 7, which equals 21.
What formula is used to calculate the mean and what is the mean for the provided data?
-The mean is calculated using the formula (sum of X values) / (total number of values). The mean for the provided data is 16, obtained by adding all the values (7 + 11 + 11 + 15 + 20 + 20 + 28) and dividing by 7.
How are the deviations (x - x̄) calculated in the dataset?
-Deviations are calculated by subtracting the mean (x̄) from each data value (x). For example, 7 - 16 equals -9, and 11 - 16 equals -5.
What is the purpose of squaring the deviations (x - x̄) in the calculation process?
-Squaring the deviations is part of the process to calculate the variance. It ensures that all deviations are positive and can be summed without cancellation, regardless of whether they are positive or negative.
How is the variance calculated and what is the variance for the given data?
-The variance is calculated using the formula Σ(x - x̄)² / (N - 1). For the given data, the variance is 30.8 divided by 6, which equals approximately 5.1333.
What is the standard deviation and how is it found?
-The standard deviation is a measure of the amount of variation or dispersion in a set of values. It is found by taking the square root of the variance. For the given data, the standard deviation is approximately 7.65.
In the example provided, how is the median calculated when there is an even number of data points?
-When there is an even number of data points, the median is calculated by taking the average of the two middle numbers. In the example, the median is calculated as (7 + 13) / 2, which equals 10.
What is the significance of understanding the concepts of mean, median, mode, range, variance, and standard deviation in data analysis?
-Understanding these concepts is crucial as they provide different perspectives on the central tendency and dispersion of data. The mean gives the average value, the median represents the middle value, the mode shows the most frequent value, the range indicates the spread of data, the variance measures the spread squared, and the standard deviation is the square root of the variance, giving a measure of dispersion in the same units as the data. These collectively help in making informed decisions and predictions based on the data.
Outlines
📊 Introduction to Statistical Concepts
This paragraph introduces the viewers to the process of calculating various statistical measures such as standard deviation, variance, mean, median, mode, and range. It emphasizes the importance of arranging data in ascending order and identifies the median as the middle value in the dataset. The mode is explained as the number that appears most frequently, and in this case, there are two modes, 11 and 20. The range is calculated by subtracting the smallest value from the largest, resulting in 21. The mean is found by summing all data values and dividing by the number of values, yielding a result of 16. The paragraph concludes with an explanation of how to calculate the variance and standard deviation, laying the groundwork for further statistical analysis.
🔢 Calculation of Variance and Standard Deviation
In this paragraph, the focus is on calculating the variance and standard deviation from the given data. It begins by summing the squared differences between each data point and the mean, resulting in a sum of 308. The variance is then found by dividing this sum by the number of data points minus one, which equals 51.333. The standard deviation, represented by 's', is derived by taking the square root of the variance, resulting in a value of approximately 7.65. The paragraph also addresses the concept of median in the context of an even number of data points, where the median is the average of the two middle numbers, leading to a median value of 10 in the given example.
Mindmap
Keywords
💡Standard Deviation
💡Variance
💡Mean
💡Median
💡Mode
💡Range
💡Data Arrangement
💡X Values
💡X̄ (Mean Symbol)
💡Σ (Sigma Notation)
💡Calculation Steps
Highlights
The video tutorial provides a step-by-step guide to finding key statistical measures for given data.
Data should be rearranged from lowest to highest order before analysis.
The median is the middle number in an ordered dataset.
The mode is the number that appears most frequently in a dataset, and there can be more than one.
The range is calculated by subtracting the smallest value from the largest value in the dataset.
The mean (x̄) is calculated by dividing the sum of all data values by the total number of values.
To find the variance, one must first calculate the difference between each data point and the mean, then square these differences.
The variance is the average of the squared differences from the mean and is calculated using the formula σ² = Σ(x - x̄)² / (n - 1).
The standard deviation (s) is the square root of the variance and represents the average distance of data points from the mean.
When the dataset contains an even number of values, the median is found by averaging the two middle numbers.
The video demonstrates the calculation of statistical measures through a clear and structured approach.
The tutorial is designed to make complex statistical concepts accessible and easy to understand.
Practical examples are used throughout the tutorial to illustrate the calculation process.
The method presented in the video can be applied to any dataset to determine its central tendency and dispersion.
The tutorial emphasizes the importance of ordering data and understanding each statistical measure's role in data analysis.
The video provides a comprehensive guide suitable for learners at various levels of statistical knowledge.
The clear explanation of statistical terms and formulas helps to demystify the process of data analysis.
The tutorial concludes with a recap of the statistical measures calculated and their significance.
Transcripts
Browse More Related Video
How to find the mean, median, mode, standard deviation and variance.

Math 119 Chapter 3 part 2
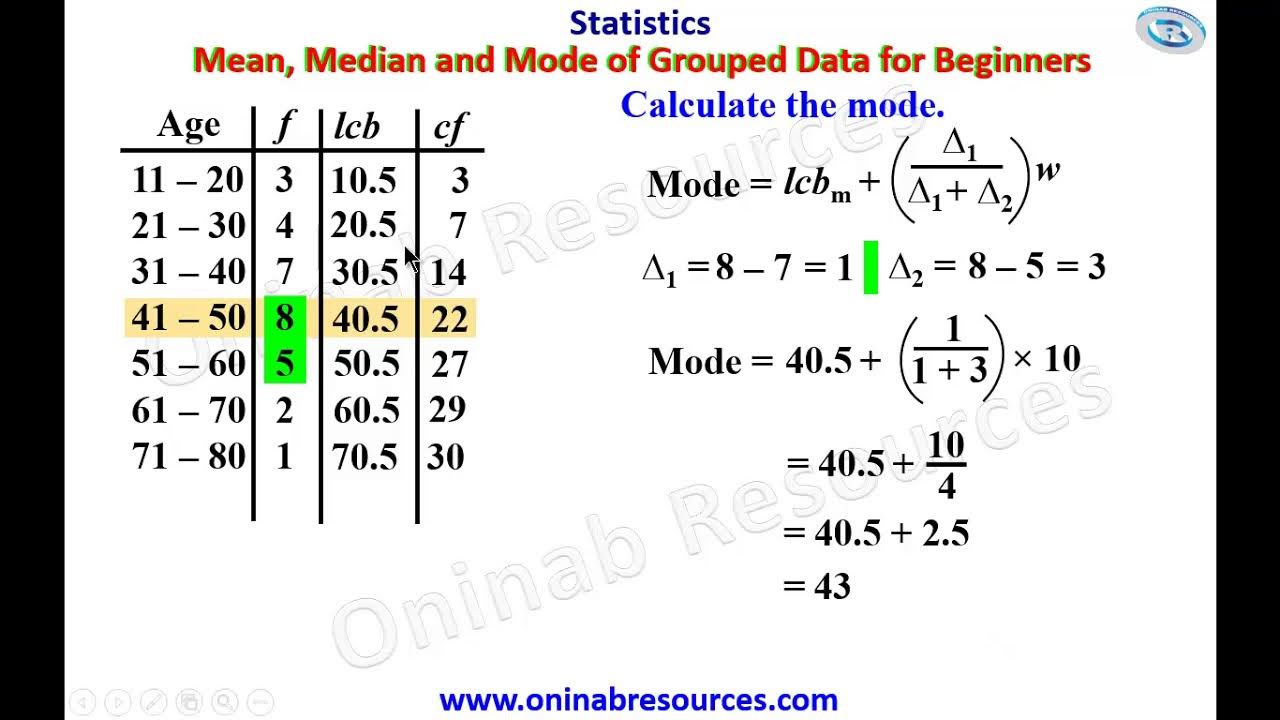
Measure of Central Tendency of Grouped Data for beginners

Mode, Median, Mean, Range, and Standard Deviation (1.3)
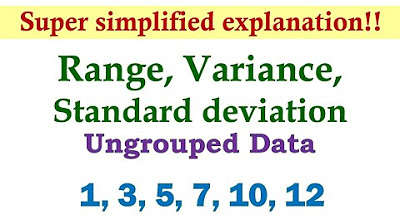
Measures of Dispersion (Ungrouped Data) | Basic Statistics
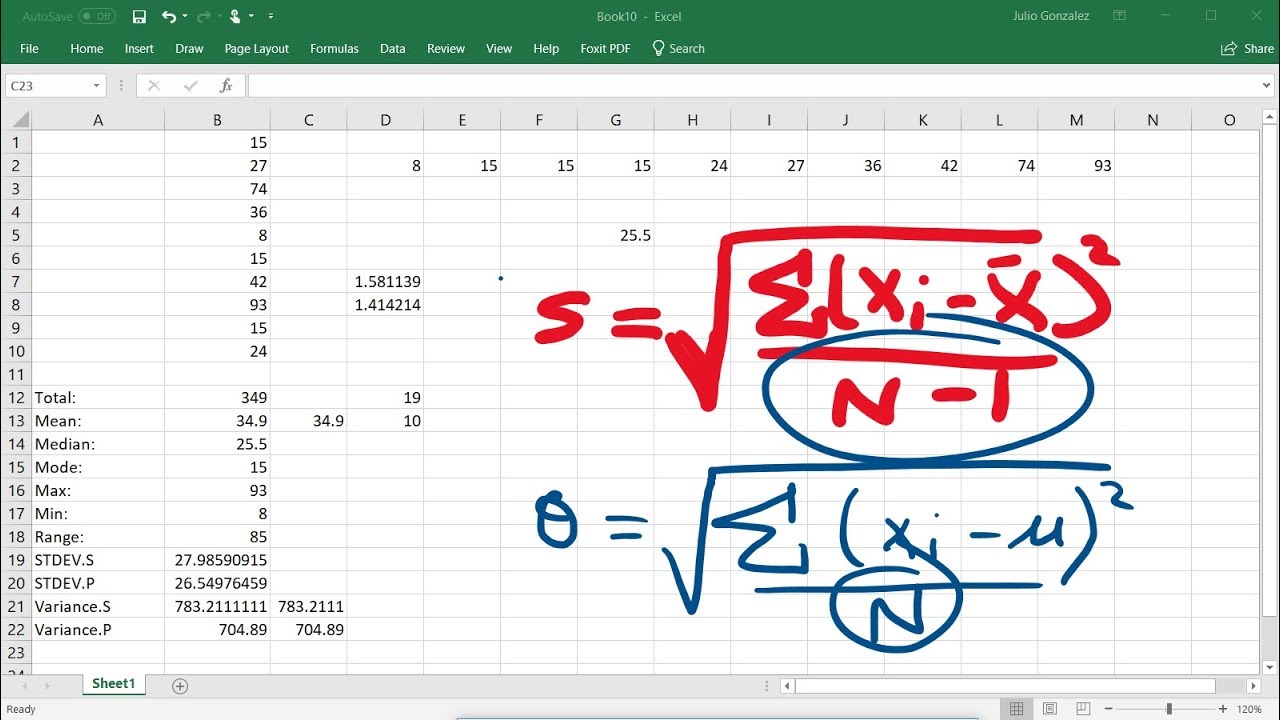
Calculating The Standard Deviation, Mean, Median, Mode, Range, & Variance Using Excel
5.0 / 5 (0 votes)
Thanks for rating: