Find the Mean, Variance, & Standard Deviation of Frequency Grouped Data Table| Step-by-Step Tutorial
TLDRThis video tutorial guides viewers through calculating the mean, variance, and standard deviation for grouped data. It begins by explaining how to find the midpoints between given scores, then uses these midpoints and corresponding frequencies to compute the mean. The video proceeds to illustrate variance calculation by finding the differences between each score and the mean, squaring them, and averaging. Finally, the standard deviation is derived from the variance. The step-by-step process is clearly outlined, making it accessible for learners.
Takeaways
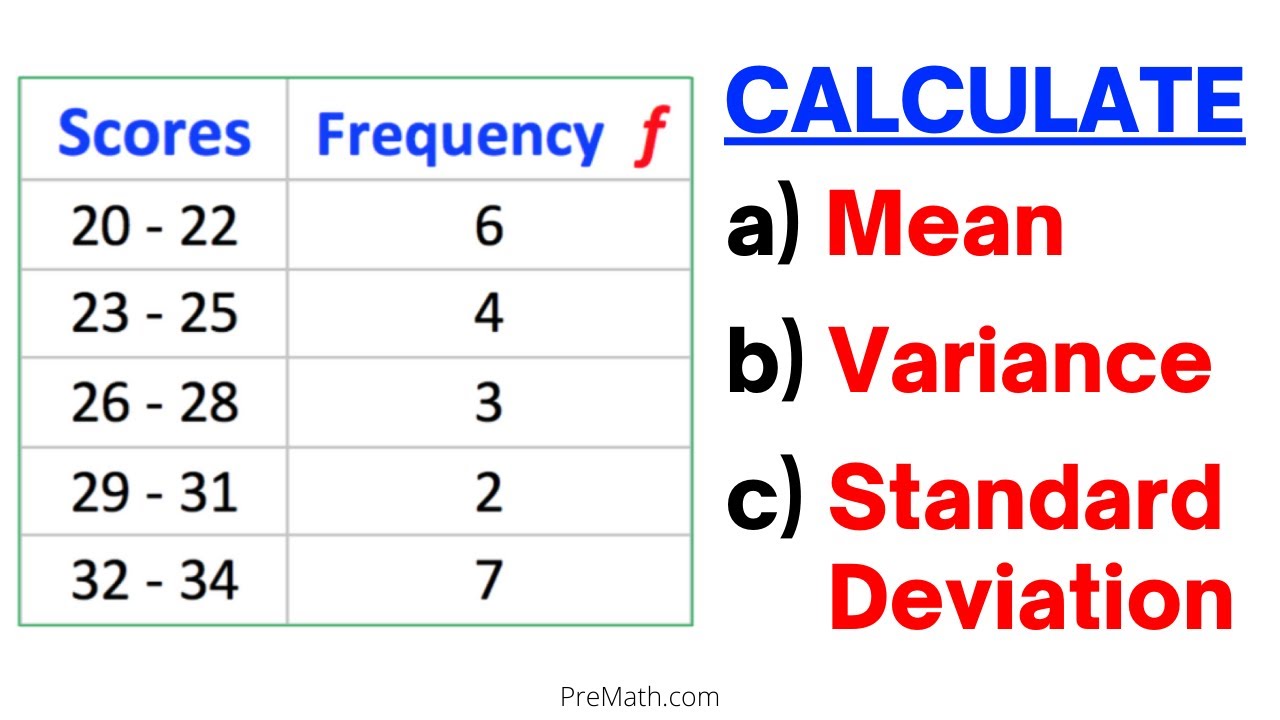
- 📊 The video tutorial focuses on calculating mean, variance, and standard deviation from grouped data with given scores and frequencies.
- 📝 The first step in the process is to calculate the mean (x̄) by finding the midpoint (x) between each pair of scores and then using the formula x̄ = (Σf * x) / Σf.
- 🔢 To find the midpoint (x) between two scores, add the scores together and divide by 2, e.g., (40 + 45) / 2 = 42.5.
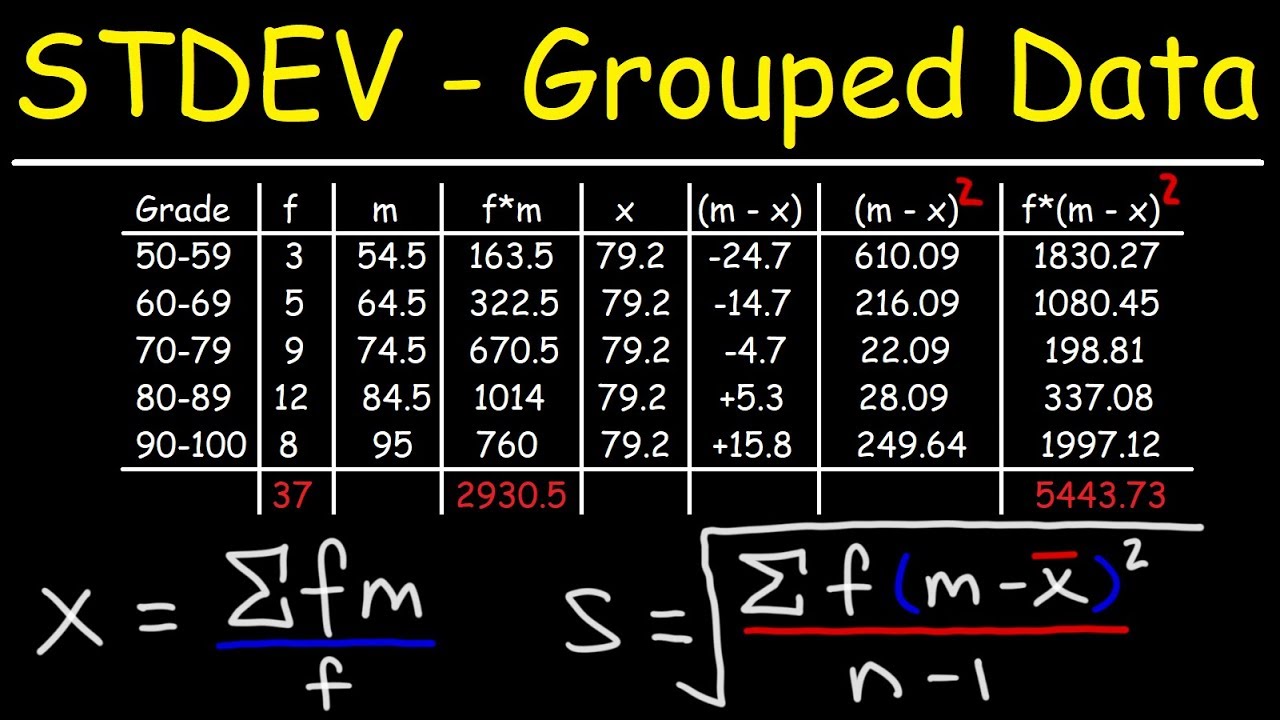
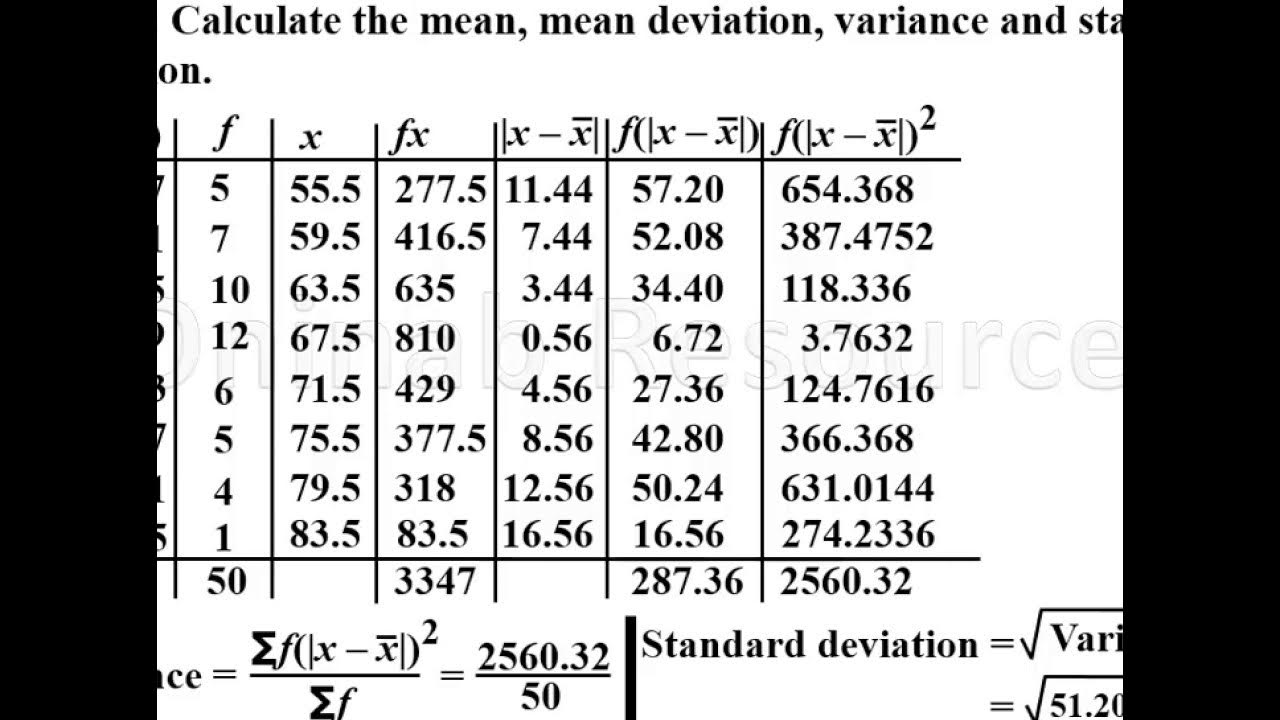
- 🧮 The next step is to calculate the variance, which involves finding the difference between each score (x) and the mean (x̄), squaring these differences, and then using the formula Variance = (Σf * (x - x̄)^2) / (Σf - 1) for a sample.
- 📐 The standard deviation is the square root of the variance and is represented by the formula SD = √Variance.
- 📈 The video provides a step-by-step calculation with an example, showing how to multiply frequencies (f) by the midpoint (x) and then by the squared differences from the mean (x̄).
- 🌟 The tutorial emphasizes the importance of accurate calculations when handling the data and performing the necessary arithmetic operations.
- 📋 The final results of the calculations in the example are a mean (x̄) of 25.4, a variance of 107.15, and a standard deviation of 10.35.
- 🎓 The concepts explained in the video are fundamental to statistics and are used to understand data distribution and variability.
- 🔍 The process demonstrated can be applied to any set of grouped data to analyze the central tendency and dispersion of the dataset.
- 👍 The video encourages viewers to subscribe for more educational content on similar topics.
Q & A
What is the main topic of the video?
-The main topic of the video is to calculate the mean, variance, and standard deviation for given grouped data.
How is the midpoint (x) between two scores calculated?
-The midpoint (x) between two scores is calculated by adding the two scores together and then dividing by 2.
What is the purpose of calculating the midpoints in the frequency distribution?
-The purpose of calculating the midpoints is to use them in the formulas for calculating the mean, variance, and standard deviation.
What is the formula for calculating the mean (x bar)?
-The formula for calculating the mean (x bar) is the sum of the products of frequency (f) and the midpoint (x), divided by the total sum of frequencies (sigma of f).
What is the mean calculated in the video?
-The mean calculated in the video is 25.4.
How is the variance calculated?
-The variance is calculated by taking the sum of the products of the frequency (f) and the squared difference between the score (x) and the mean (x bar), and then dividing by the total frequency minus 1 (for a sample).
What is the variance obtained in the video?
-The variance obtained in the video is 107.15.
What is the standard deviation?
-The standard deviation is the square root of the variance and represents the average amount of variation or dispersion of the scores from the mean.
What is the standard deviation calculated in the video?
-The standard deviation calculated in the video is 10.35.
How does the process demonstrated in the video relate to real-world data analysis?
-The process demonstrated in the video is a fundamental statistical method used in real-world data analysis to understand the central tendency and variability of a dataset, which can be applied in various fields such as finance, healthcare, and research.
Why is it important to understand the mean, variance, and standard deviation of a dataset?
-Understanding the mean, variance, and standard deviation of a dataset is important because it provides insights into the overall pattern and spread of the data, which can help in making informed decisions and predictions based on the data.
Outlines
📊 Calculating the Mean
This paragraph introduces the process of calculating the mean for a given set of grouped data. The tutorial begins by explaining the concept of the mean and proceeds to demonstrate how to calculate it using the provided scores and their corresponding frequencies. The calculation involves finding the midpoint (x) between each pair of scores and then summing up the products of the midpoints and their frequencies. The mean (x bar) is then determined by dividing the sum of these products by the total frequency. The result obtained for the mean in this example is 25.4.
📈 Variance Calculation
This section delves into the calculation of variance, which measures the spread of the data points around the mean. The process starts by finding the difference between each score (x) and the previously calculated mean (x bar). These differences are then squared, and the frequencies are multiplied with each squared difference. The sum of these products is calculated, and the variance is derived by dividing this sum by the total frequency minus one. The variance value obtained in this example is 107.15.
📊 Determining the Standard Deviation
The final part of the tutorial focuses on calculating the standard deviation, which is a measure of the average distance of the data points from the mean and provides an understanding of the data's variability. The standard deviation is found by taking the square root of the variance calculated in the previous step. The square root of the variance value (107.15) results in a standard deviation of 10.35. The tutorial concludes with a reminder to subscribe for more informative content.
Mindmap
Keywords
💡mean
💡variance
💡standard deviation
💡grouped data
💡midpoint
💡frequency
💡sigma notation
💡calculation
💡data analysis
💡statistical measures
💡score values
Highlights
The tutorial begins with an introduction to calculating the mean for given grouped data.
The concept of midpoint, or the value between two data points, is explained through the example of 40 and 45.
A step-by-step method for finding the midpoint is provided, emphasizing the division and addition process.
The tutorial demonstrates how to calculate the mean (x bar) using the sigma notation for the sum of frequencies and midpoints.
The mean is calculated to be 25.4, using the formula and previously found values.
The process of calculating variance is introduced, including the use of mean values and data points.
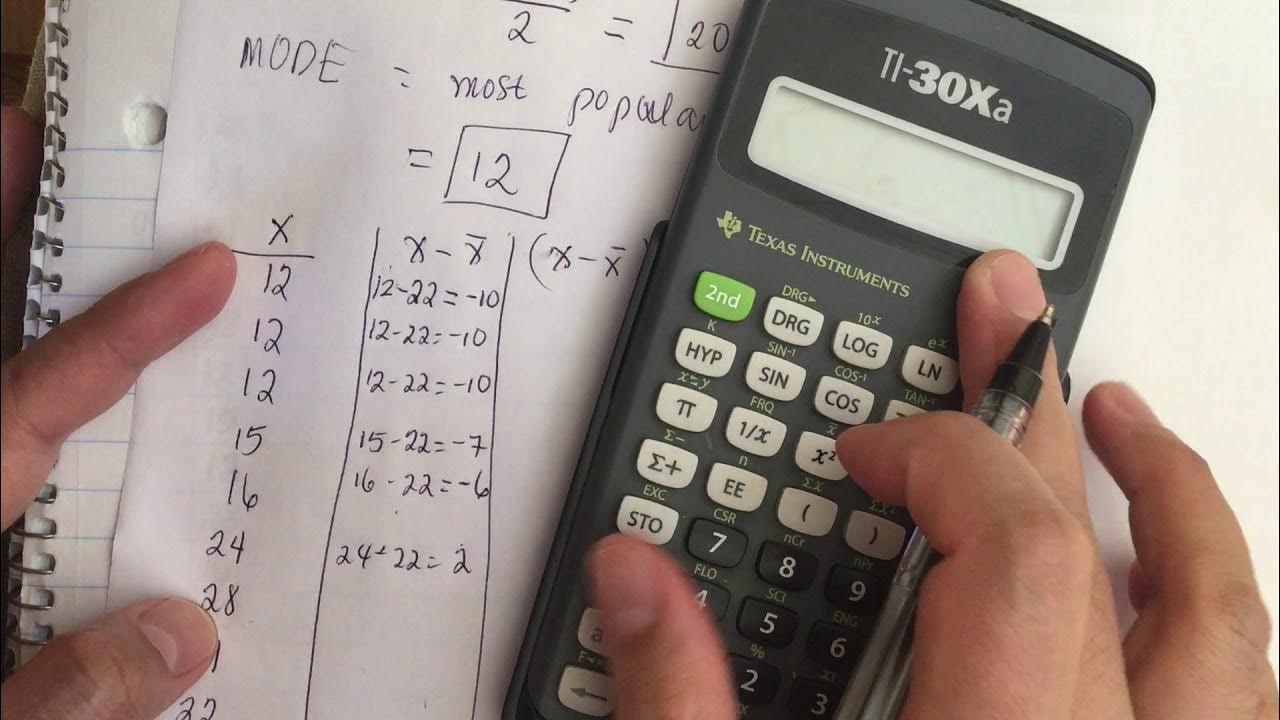
A detailed explanation of finding the difference between each data point and the mean is provided.
The tutorial shows how to square the differences and multiply them by their respective frequencies for variance calculation.
Variance is calculated as 107.15, using the sum of squared differences divided by the number of data points minus one.
The concept of standard deviation is introduced as the square root of variance.
The standard deviation is calculated to be 10.35, derived from the square root of the previously calculated variance.
The tutorial emphasizes the use of sample data in the calculations and the application of appropriate formulas.
The presenter provides a comprehensive guide on calculating mean, variance, and standard deviation for grouped data.
The tutorial concludes with a summary of the final results and an encouragement for viewers to subscribe for more content.
Throughout the tutorial, clear examples and calculations are used to illustrate statistical concepts, making them accessible to learners.
The use of sigma notation is explained for both the sum of products and the sum of frequencies, enhancing the understanding of statistical calculations.
Transcripts
Browse More Related Video
Can You Find Mean, Variance, & Standard Deviation of a Frequency Grouped DataTable? Simple Tutorial
How To Calculate The Standard Deviation of Grouped Data
Mean deviation, variance and standard deviation of grouped data.

What is a "Standard Deviation?" and where does that formula come from
How to find the mean, median, mode, standard deviation and variance.
Variance - Clearly Explained (How To Calculate Variance)
5.0 / 5 (0 votes)
Thanks for rating: