How to Calculate Standard Deviation
TLDRThis script explains the concept and calculation of standard deviation, a statistical measure that reflects the spread of data. Using the example of the number of vegetables in five friends' fridges, it outlines the steps: calculating the mean, finding differences from the mean, squaring these differences, calculating the mean of squared differences, and finally taking the square root. The result is a standard deviation that helps determine if a data point is typical or an outlier within a dataset.
Takeaways
- 📊 Standard deviation is a statistical measure that indicates the spread or variability of data points in a dataset.
- 🥦 The script uses the example of counting the number of vegetables in five friends' fridges to illustrate the concept of standard deviation.
- 🧾 The first step in calculating standard deviation is to find the mean (average) of the data set, denoted as X̄ or x-bar.
- 📝 After finding the mean, subtract the mean from each data point to calculate the differences.
- 🔢 The differences obtained are then squared to ensure all values are positive and to emphasize larger deviations over smaller ones.
- 📊 The mean of these squared differences is calculated by summing them up and dividing by the number of data points (n).
- 🌟 The square root of this mean of squared differences yields the standard deviation, representing the average distance from the mean.
- 🔍 Knowing the standard deviation helps to understand if a data point is typical or an outlier within the dataset.
- 📈 Approximately two-thirds of the data falls within one standard deviation of the mean, assuming a normal distribution.
- 🎓 The formula for standard deviation is represented with the lowercase sigma (σ) for a population and involves summing each data point (X), squaring the differences, and taking the square root.
- 📝 There is a variation of the standard deviation formula that divides by n-1 instead of n, used when working with a sample rather than the entire population.
Q & A
What is standard deviation and how does it relate to data distribution?
-Standard deviation is a statistical measure that quantifies the amount of variation or dispersion in a data set. It indicates how spread out the data points are from the mean of the data. A smaller standard deviation indicates that the data points are closer to the mean, while a larger standard deviation indicates that the data points are more spread out. It is used for data that is normally distributed and helps identify whether a data point is an outlier or falls within a normal range.
How can you use standard deviation to determine if someone's behavior is normal or extraordinary?
-By comparing an individual's behavior to the standard deviation of a group, you can determine if the individual's behavior falls within the normal range. If the behavior is within one standard deviation of the mean, it is considered normal. However, if the behavior is more than one standard deviation away from the mean, it may be considered extraordinary or unusual. This method provides a statistical basis for evaluating the typicality of behavior.
What are the steps involved in calculating the standard deviation for a given data set?
-The steps to calculate the standard deviation are: (1) calculate the mean of the data set, (2) find the difference between each data point and the mean, (3) square each difference, (4) calculate the mean of the squared differences, and (5) take the square root of the result from step 4. This process will yield the standard deviation for the data set.
What is the difference between the mean and the standard deviation in the context of data analysis?
-The mean, or average, of a data set is a single value that represents the central tendency of the data, calculated by summing all the data points and dividing by the number of points. The standard deviation, on the other hand, measures the spread or variability of the data around the mean. While the mean tells you the 'average' value, the standard deviation tells you how much the individual data points deviate from that average.
What is the significance of calculating both the mean and standard deviation together?
-Calculating both the mean and standard deviation together provides a more comprehensive understanding of the data set. The mean gives you the central value, while the standard deviation indicates the variability or spread of the data. Together, they can help identify outliers, understand the concentration of data points, and assess the overall distribution of the data.
How can standard deviation be calculated without a calculator or software?
-Standard deviation can be calculated manually through a series of mathematical operations. First, find the mean of the data set. Then, for each data point, subtract the mean to find the difference, square each difference, and find the mean of these squared differences. Finally, take the square root of this mean to obtain the standard deviation. This process can be performed with pen and paper or with the aid of a scientific calculator or spreadsheet software for larger data sets.
What is the formula for calculating the standard deviation of a population?
-The formula for calculating the standard deviation of a population is: σ = √(Σ(x - μ)² / N), where σ is the standard deviation, Σ denotes the sum of the squared differences, x represents each data point, μ is the population mean, and N is the number of data points in the population.
How does the standard deviation formula differ for a sample of a population?
-For a sample of a population, the standard deviation formula is slightly modified to provide an unbiased estimate of the population standard deviation. The formula is: s = √(Σ(x - x̄)² / (n - 1)), where s is the sample standard deviation, x is each data point, x̄ is the sample mean, and n is the number of data points in the sample. The division by (n - 1) instead of n corrects the bias in the estimation of the population standard deviation.
What is the assumption behind using the standard deviation to determine if a data point is an outlier?
-The assumption behind using standard deviation to identify outliers is that the data follows a normal distribution. In a normal distribution, about 68% of the data points fall within one standard deviation of the mean, 95% within two standard deviations, and 99.7% within three standard deviations. Therefore, if a data point falls outside these ranges, it may be considered an outlier.
How can you apply the concept of standard deviation in real-life scenarios?
-Standard deviation can be applied in various real-life scenarios, such as quality control in manufacturing, where it can help determine the consistency of products; in finance, to assess the risk associated with investments; and in research, to analyze the variability in experimental results. It is a valuable tool in any situation where understanding the spread of data points is important.
What does the standard deviation indicate about the data if it is zero?
-A standard deviation of zero indicates that there is no variation or dispersion in the data set. All data points are exactly equal to the mean, meaning there is no spread or variability among the values. This is a rare occurrence in practical scenarios and often indicates a data entry error, lack of measurement, or a very controlled experimental condition.
How does the size of the standard deviation relate to the potential for outliers in a data set?
-A larger standard deviation indicates a greater spread of data points, which means there is a higher likelihood of outliers – values that fall significantly outside the typical range of the data set. Conversely, a smaller standard deviation suggests that the data points are closely clustered around the mean, reducing the chance of outliers.
Outlines
📊 Understanding Standard Deviation
This paragraph introduces the concept of standard deviation and its relevance in determining whether a particular behavior or data point is common or an outlier within a dataset. It explains that standard deviation, when calculated alongside the mean, indicates the spread of the data. The paragraph also outlines that standard deviation is applicable for normally distributed data and can be computed using a calculator or spreadsheet software, or through manual mathematical operations. An example is provided using the number of vegetables five friends have in their fridges to illustrate the step-by-step process of calculating standard deviation, which includes calculating the mean, finding the differences from the mean, squaring these differences, calculating the mean of these squared differences, and finally taking the square root of this mean.
Mindmap
Keywords
💡Standard Deviation
💡Mean
💡Data Set
💡Outlier
💡Distribution
💡Graphing Calculator
💡Spreadsheet Software
💡Squaring Differences
💡Mean of Squared Differences
💡Square Root
💡Population and Sample
Highlights
Standard deviation is a measure of how spread out a data set is.
It is commonly used alongside the mean to understand data distribution.
Standard deviation is particularly useful for data that follows a normal distribution.
It can be easily calculated using a graphing calculator or spreadsheet software.
The calculation process involves five main steps.
The first step is to calculate the mean of the data set.
The second step is to find the differences between each data point and the mean.
The third step is to square each of the differences.
The fourth step is to calculate the mean of these squared differences.
The final step is to take the square root of the mean of squared differences.
The example used in the transcript involves the number of vegetables in five friends' fridges.
The mean number of vegetables in the example is five.
The standard deviation in the example is approximately 2.6.
About two-thirds of the data fall within one standard deviation of the mean.
The use of standard deviation helps to identify whether a data point is an outlier.
The formula for calculating standard deviation is provided, using symbols to represent the sum, data points, mean, and number of data points.
A variation of the standard deviation formula is used for sample data instead of a full population.
Transcripts
Browse More Related Video

What is Standard Deviation and Mean Absolute Deviation | Math, Statistics for data science, ML

What is a "Standard Deviation?" and where does that formula come from
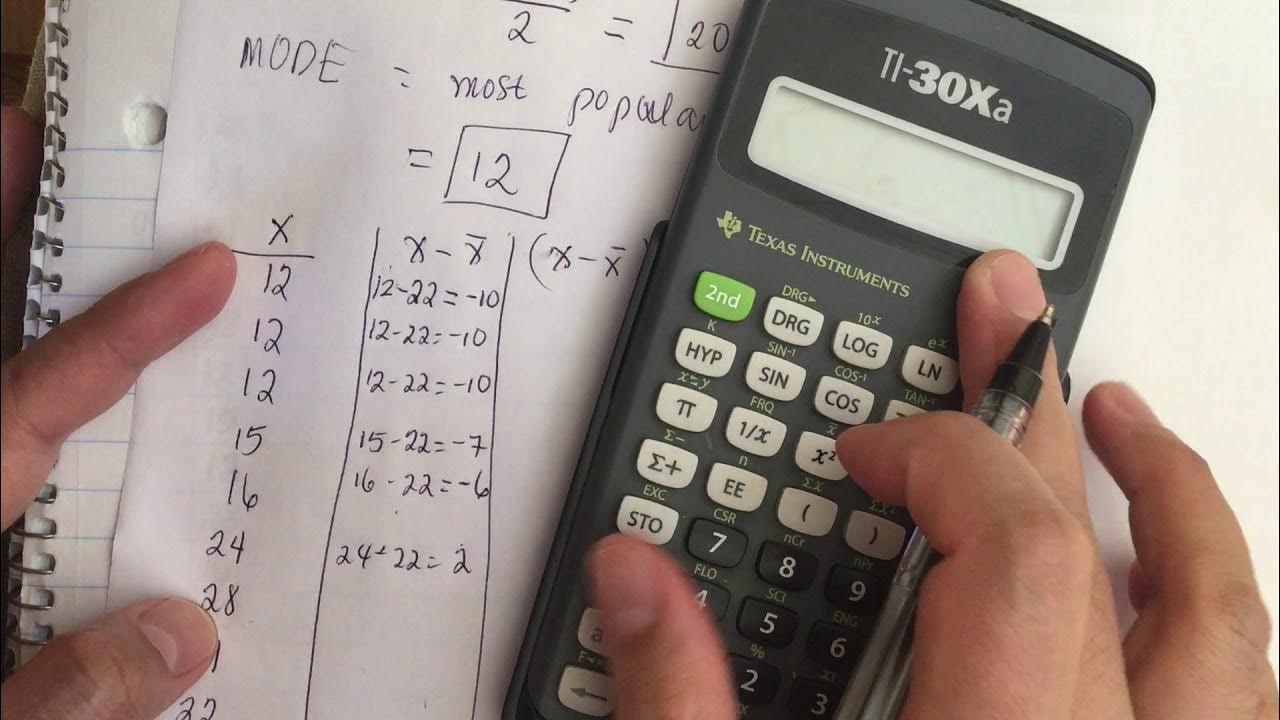
How to find the mean, median, mode, standard deviation and variance.
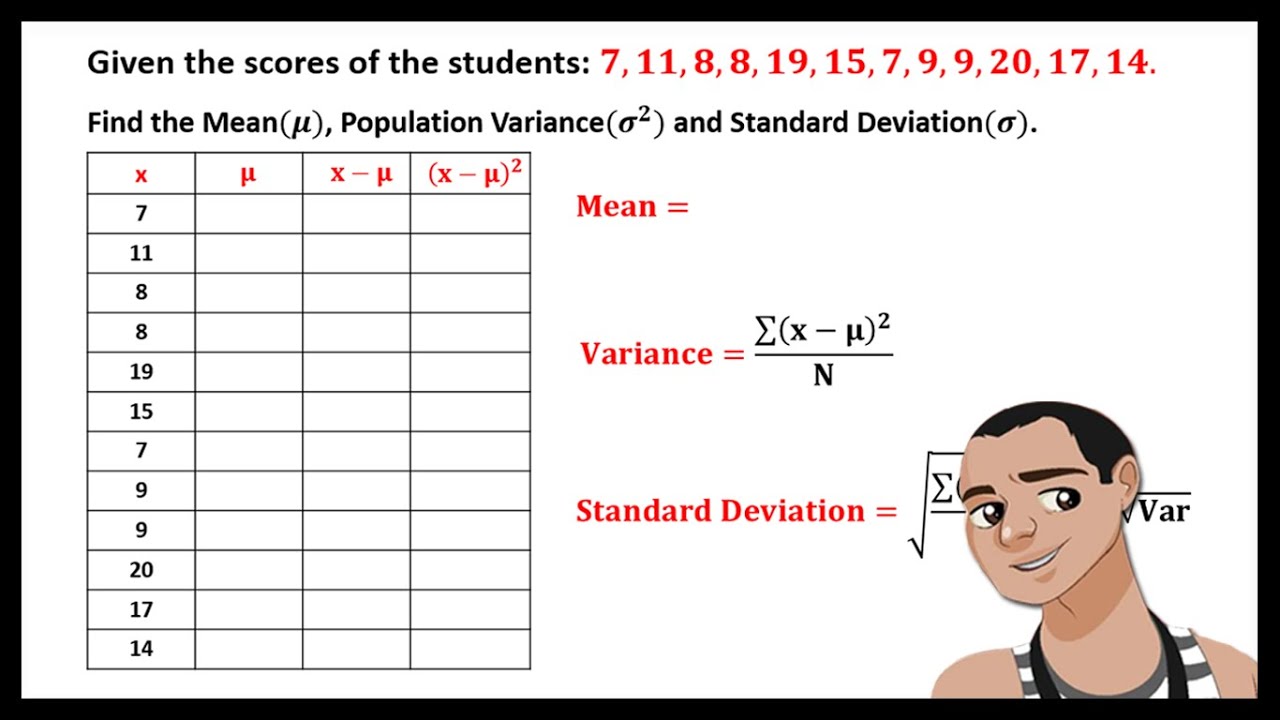
MEAN, VARIANCE, AND STANDARD DEVIATION FOR UNGROUPED DATA
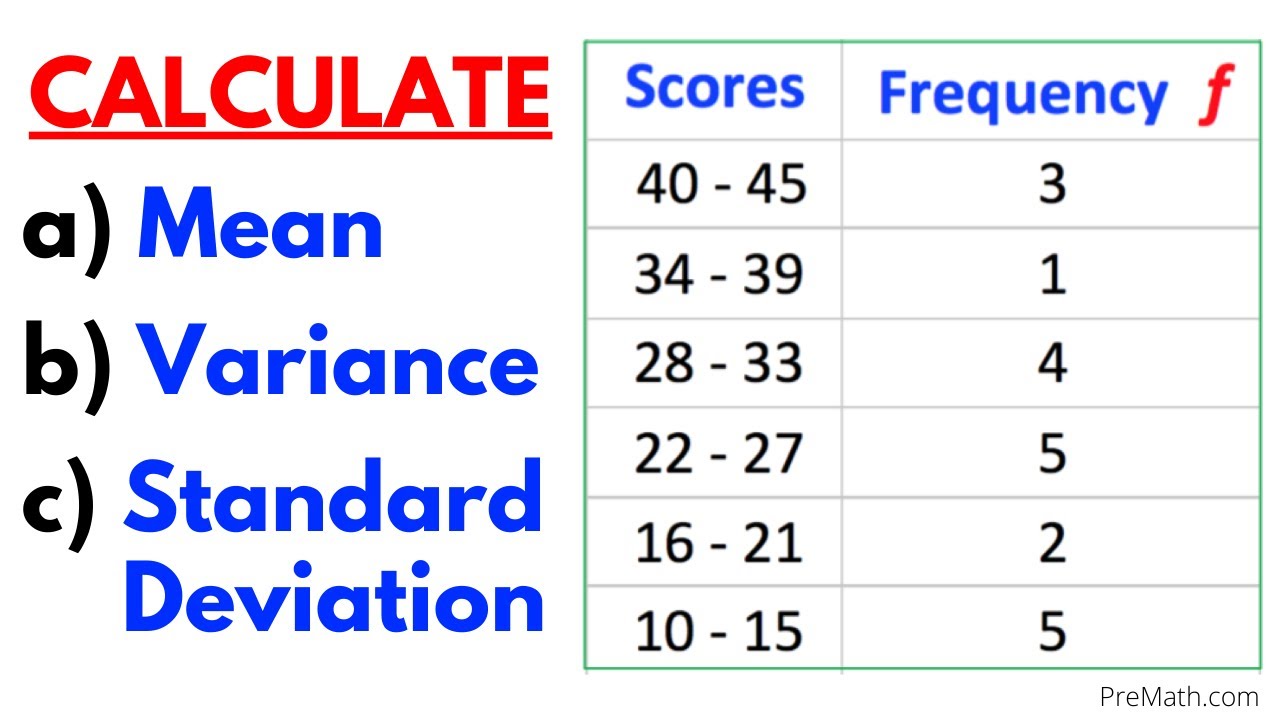
Find the Mean, Variance, & Standard Deviation of Frequency Grouped Data Table| Step-by-Step Tutorial
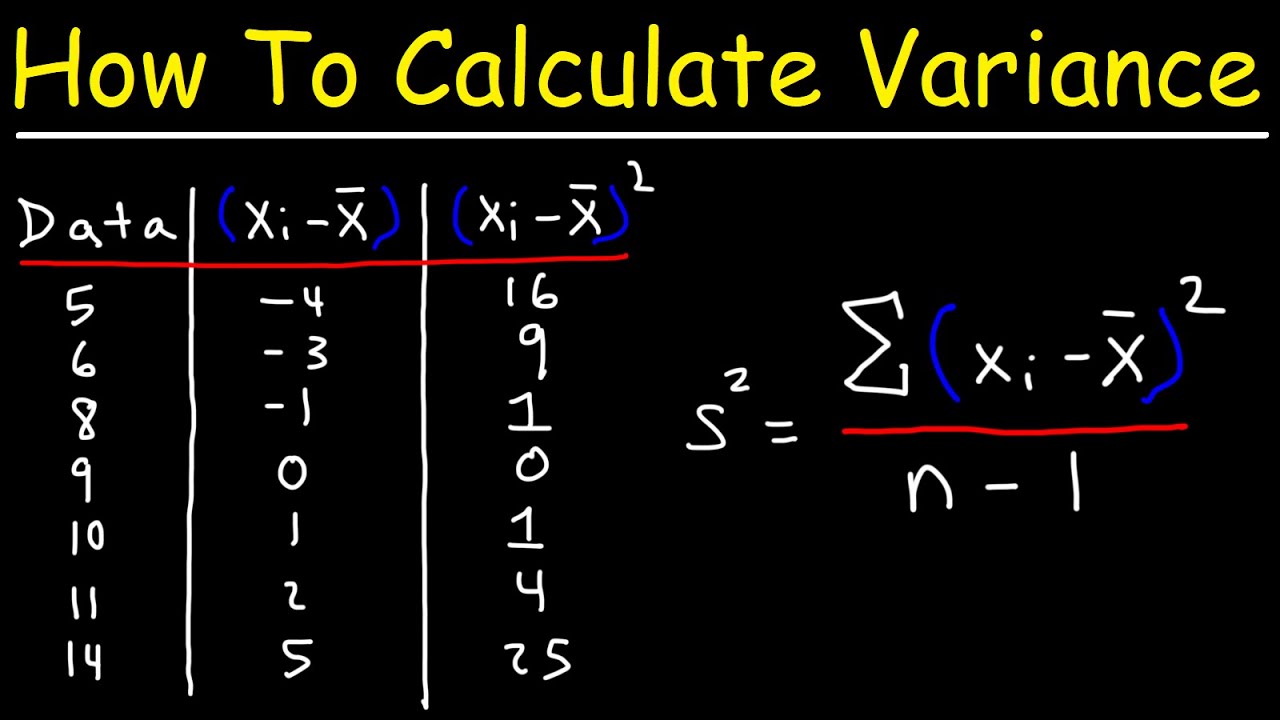
How To Calculate Variance
5.0 / 5 (0 votes)
Thanks for rating: