MEAN, VARIANCE, AND STANDARD DEVIATION FOR UNGROUPED DATA
TLDRIn this educational video, the presenter guides viewers through calculating the mean, population variance, and standard deviation of a set of student scores. The process involves summing the scores to find the mean, then using the variance formula to determine the spread of the data. The standard deviation is calculated by taking the square root of the variance, resulting in a mean of 12, a variance of 21, and a standard deviation of 4.58, illustrating the basic statistical measures for the given data set.
Takeaways
- 📚 The problem involves calculating the mean, population variance, and standard deviation for a set of student scores.
- 🔢 The mean is calculated by summing all the scores and dividing by the number of scores, resulting in a mean of 12.
- 📉 To find the population variance, the formula used is the sum of the squared differences from the mean, divided by the number of scores (n), not n-1 as in the sample variance.
- 📈 The scores are first adjusted by subtracting the mean to find the deviations from the mean, which are then squared for the variance calculation.
- 📊 The squared deviations are summed up to get a total of 252, which is then divided by the number of scores (12) to find the variance, resulting in 21.
- 📏 The standard deviation is the square root of the variance, which in this case is the square root of 21, equaling 4.58.
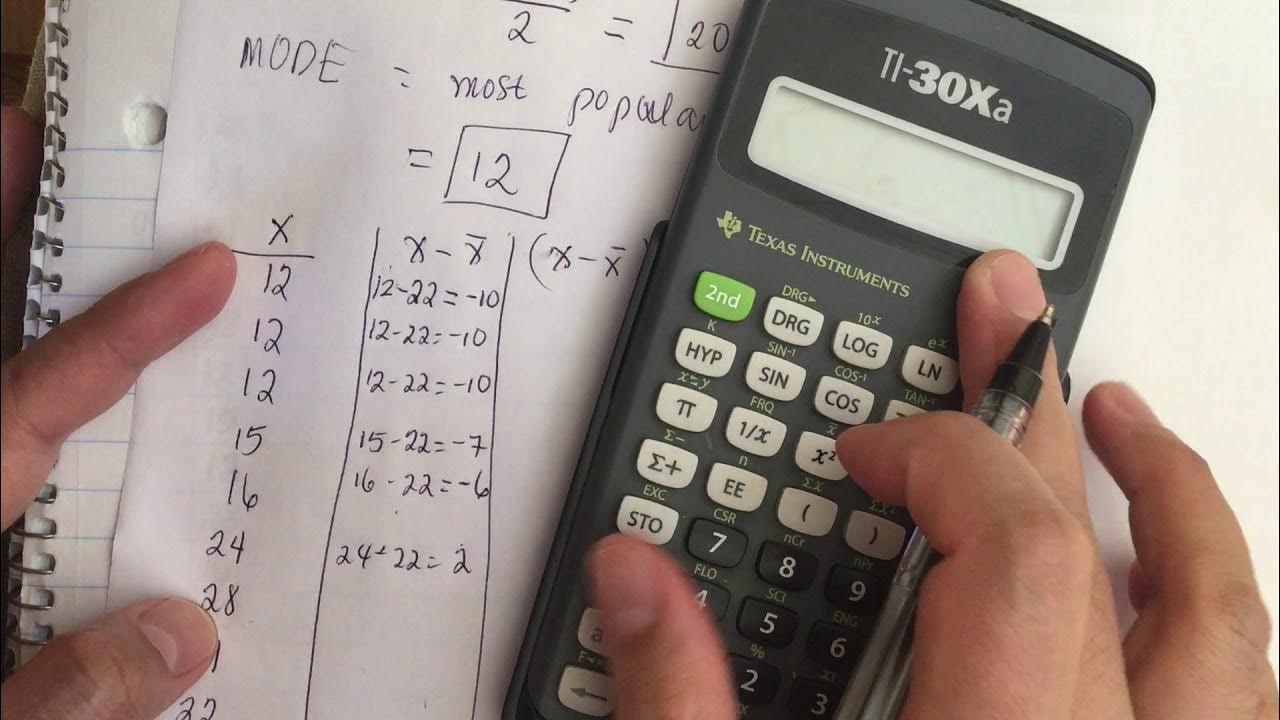
- 📋 The process involves creating a table to organize the scores, their deviations from the mean, and the squared deviations.
- 🔍 Each score is individually processed by subtracting the mean to find its deviation, which is a crucial step in variance and standard deviation calculations.
- 📘 The script demonstrates a step-by-step approach to solving statistical problems, emphasizing the importance of each calculation step.
- 📉 The variance gives a measure of the spread of the scores around the mean, indicating how much the scores vary.
- 📈 The standard deviation, being the square root of the variance, provides a measure of average distance from the mean, showing the typical deviation of scores.
Q & A
What is the first step in solving the problem presented in the script?
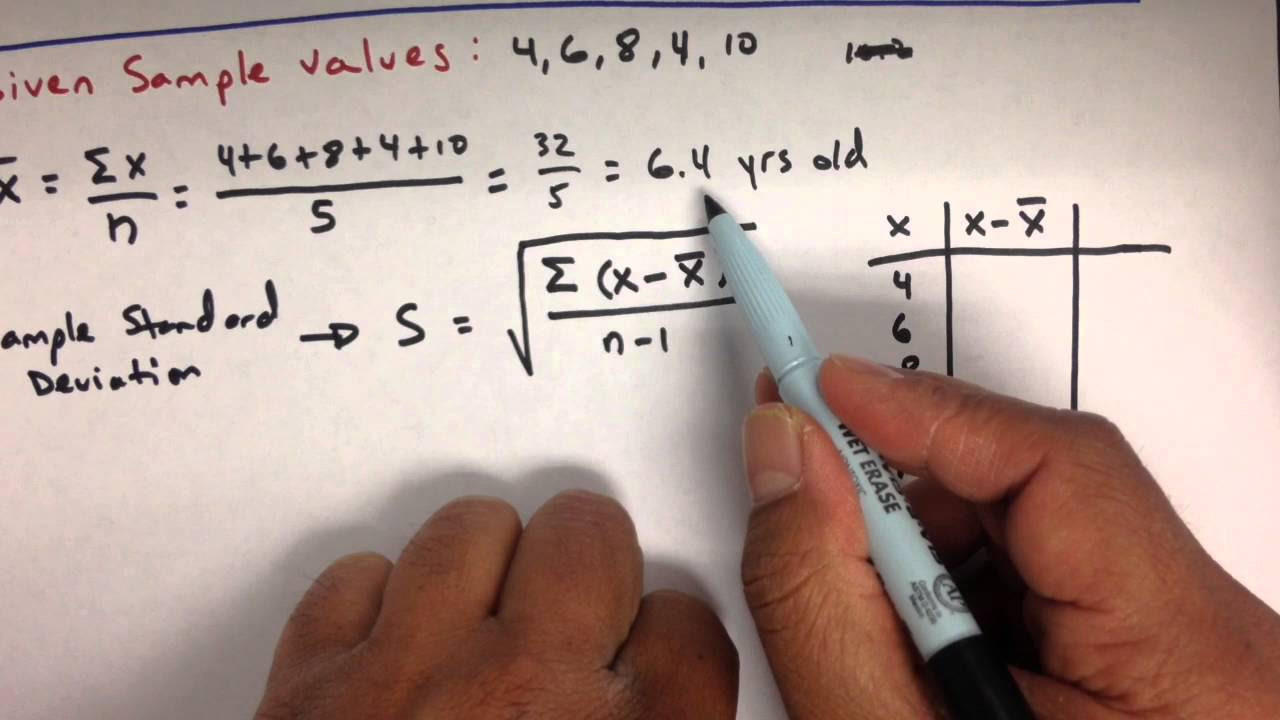
-The first step is to calculate the mean of the given student scores by adding all the numbers and dividing by the number of scores.
How many scores are there in the provided dataset?
-There are 12 scores in the dataset.
What is the calculated mean of the scores?
-The calculated mean of the scores is 12.
What is the formula for calculating the population variance?
-The formula for calculating the population variance is the sum of the squared differences between each score and the mean, divided by the number of scores (n).
How do you find the difference between each score and the mean?
-You find the difference by subtracting the mean from each individual score (x - mean).
What is the sum of the squared differences in the dataset?
-The sum of the squared differences is 252.
How is the variance calculated from the sum of the squared differences?
-The variance is calculated by dividing the sum of the squared differences (252) by the number of scores (12).
What is the calculated variance of the scores?
-The calculated variance of the scores is 21.
What is the standard deviation and how is it related to variance?
-The standard deviation is the square root of the variance, which measures the amount of variation or dispersion in the dataset.
What is the calculated standard deviation of the scores?
-The calculated standard deviation of the scores is approximately 4.58.
Why is the square of a negative number always positive?
-The square of a negative number is always positive because multiplying two negative numbers results in a positive product.
How does the script use the table to solve the problem?
-The script uses the table to organize and calculate the differences from the mean, their squares, and then to sum these values for variance and standard deviation calculations.
Outlines
📊 Calculating Mean, Variance, and Standard Deviation
This paragraph describes the process of calculating the mean, population variance, and standard deviation from a set of student scores. The mean is computed by summing all scores and dividing by the number of scores, resulting in a mean of 12. The population variance is then calculated using the formula \( \sigma^2 = \frac{\sum (x_i - \mu)^2}{N} \), where \( x_i \) represents each score, \( \mu \) is the mean, and \( N \) is the total number of scores. Each score is subtracted by the mean, squared, and summed up, then divided by the number of scores to find the variance, which is 21 in this case. The standard deviation is the square root of the variance, calculated to be 4.58.
📐 Final Values for Mean, Variance, and Standard Deviation
The second paragraph concludes the statistical calculations by presenting the final values for the mean, variance, and standard deviation. The mean of the student scores is reiterated as 12. The variance, calculated in the previous paragraph, is confirmed to be 21. The standard deviation, derived from the square root of the variance, is given as 4.58, providing a measure of the dispersion of the scores around the mean.
Mindmap
Keywords
💡Mean
💡Population Variance
💡Standard Deviation
💡Scores
💡Summation
💡Division
💡Squared
💡Sample Variance
💡Statistical Measures
💡Data Dispersion
💡Contextualization
Highlights
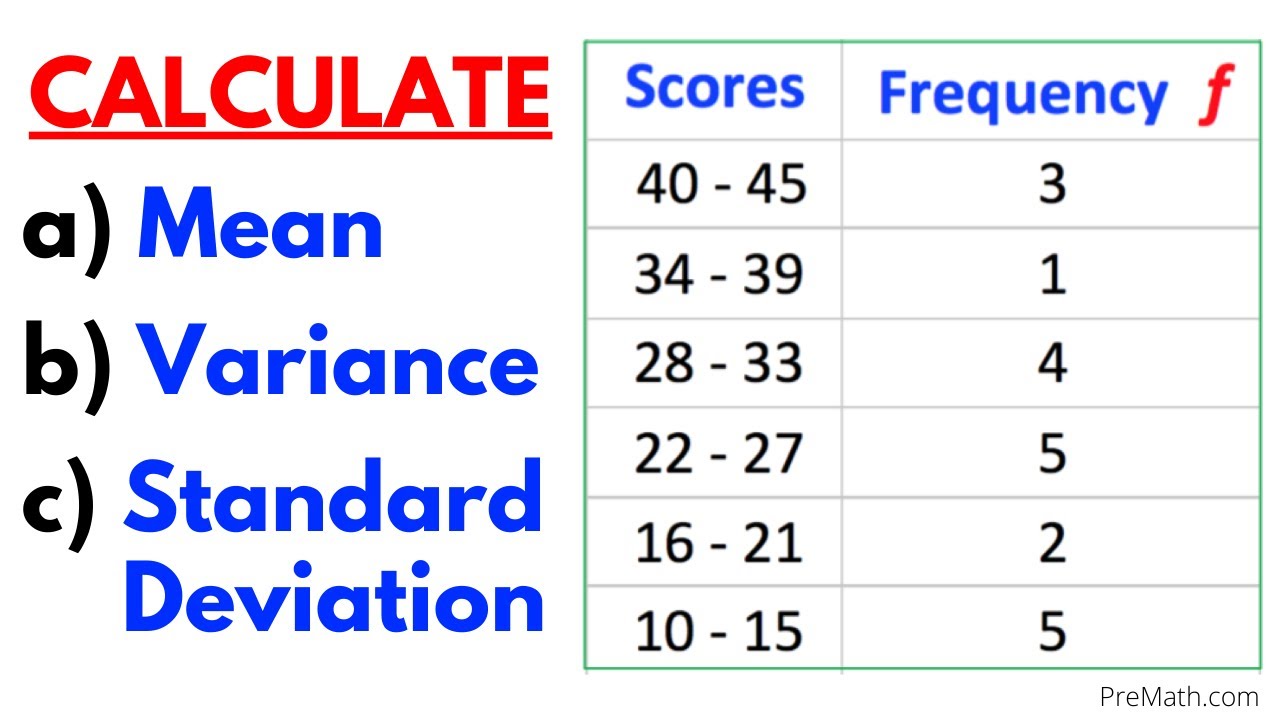
Introduction to the math problem involving calculating mean, population variance, and standard deviation using a table.
Given scores of students to find the mean by summing all scores and dividing by the number of scores.
Mean calculation result is 12 after adding individual scores and dividing by 12.
Explanation of the formula for calculating population variance, which differs from sample variance by using 'n' instead of 'n-1'.
Step-by-step calculation of 'x minus the mean' for each score to prepare for variance calculation.
Demonstration of squaring each 'x minus the mean' value as part of the variance formula.
Summation of the squared differences to find the submission for variance calculation.
Variance calculation by dividing the sum of squared differences by the number of scores (12).
Result of variance calculation is 21, indicating the dispersion of the scores around the mean.
Introduction to the concept of standard deviation as the square root of variance.
Calculation of standard deviation by taking the square root of the variance, resulting in 4.58.
Final results presented: mean is 12, variance is 21, and standard deviation is 4.58.
Emphasis on the importance of correctly identifying whether to use population or sample variance in statistical analysis.
Detailed walkthrough of the mathematical process, from summing scores to calculating mean, variance, and standard deviation.
Use of a table to organize and solve the statistical problem, showcasing a methodical approach.
Highlighting the mathematical operations involved in each step of the calculation process.
Clarification of the difference between squaring negative and positive numbers in the context of variance calculation.
Explanation of how to handle the sum of squared values in the variance formula.
Transcripts
Browse More Related Video
Variance and Standard Deviation: Sample and Population Practice Statistics Problems

Statistics: Standard deviation | Descriptive statistics | Probability and Statistics | Khan Academy
How to find the mean, median, mode, standard deviation and variance.
Measures of Dispersion (Ungrouped Data) | Basic Statistics
What is a "Standard Deviation?" and where does that formula come from
Find the Mean, Variance, & Standard Deviation of Frequency Grouped Data Table| Step-by-Step Tutorial
5.0 / 5 (0 votes)
Thanks for rating: