10.1.4 Correlation - Three Common Errors Involving Correlation
TLDRThis video script addresses three common misconceptions about correlation. It clarifies that correlation does not imply causation, using the Nobel Prize and chocolate consumption example. It warns against using data based on averages, as this can mask true relationships. Lastly, it emphasizes the importance of examining scatter plots to detect potential non-linear relationships, rather than relying solely on statistical measures like r-values and p-values.
Takeaways
- 🔗 Correlation does not imply causation: Just because two variables are correlated, it doesn't mean one causes the other.
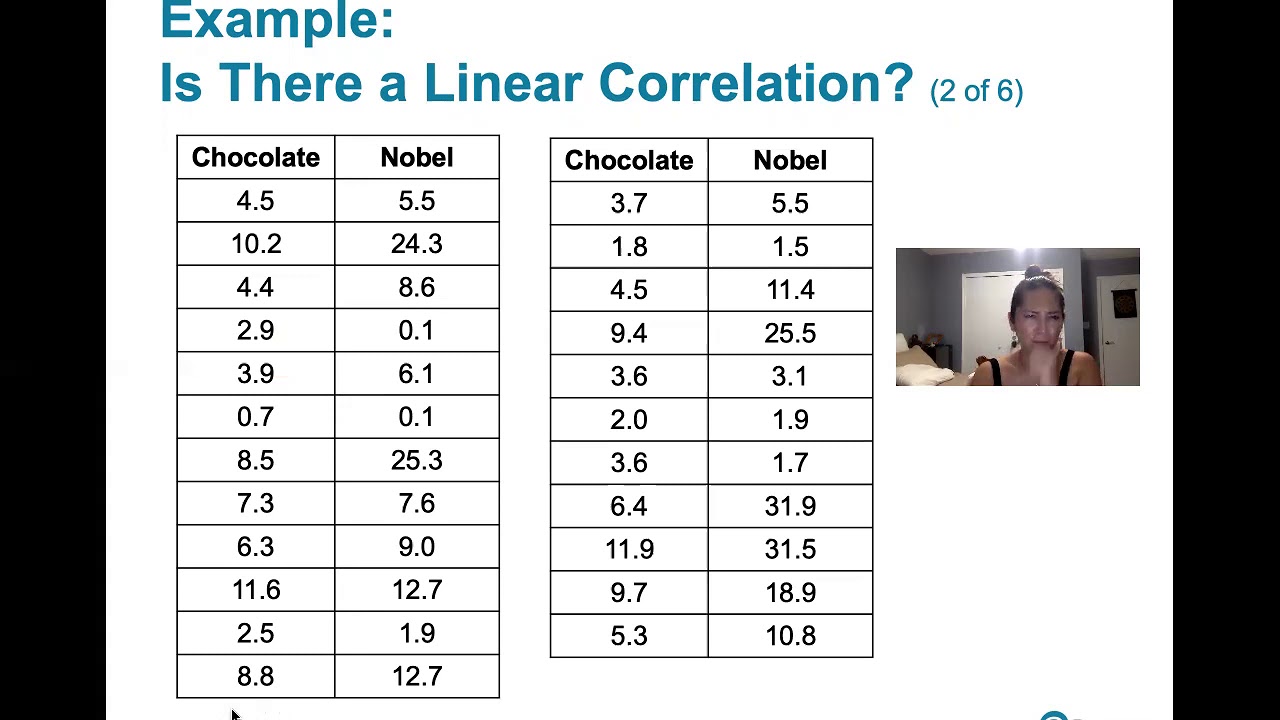
- 🍫 Nobel Prize and chocolate example: A correlation was found between chocolate consumption and Nobel Prizes, but it's incorrect to assume a causal link between the two.
- 🌡 Lurking variables: Often, the correlation between two variables is due to a third, hidden variable influencing both, such as weather affecting both crime rates and ice cream consumption.
- 🚫 Avoid assuming causality: It's unwise to assume that correlation indicates a direct cause-and-effect relationship.
- 📊 Importance of scatter plots: Examining scatter plots is crucial to detect non-linear relationships that might be overlooked by just looking at correlation coefficients.
- ❌ Error in using averages: Computing averages can mask individual variations and lead to false correlations that aren't present in the original data.
- ⛔️ Suppressing individual variation: Using averages can result in the loss of data variability, which may mislead correlation analysis.
- 📈 Non-linear relationships: Correlation analysis might suggest a linear relationship, but the actual relationship could be non-linear, such as exponential or logarithmic.
- 🤔 Be cautious with data interpretation: Numerical values like r and p-values should not be the only basis for concluding the nature of a relationship between variables.
- 🌐 Look beyond the numbers: It's essential to consider the context and visual representations of data, not just statistical measures, to understand the true relationship between variables.
- 🧐 Don't rush to conclusions: Before making any assertions about relationships, ensure to thoroughly analyze the data, including checking for non-linear patterns.
Q & A
What are the three common errors related to correlation discussed in the video?
-The three common errors are: 1) Assuming that correlation implies causality, 2) Using data based on averages which may lead to false correlations, and 3) Ignoring the possibility of a non-linear relationship between variables.
Why is it incorrect to assume that correlation implies causality?
-It is incorrect because correlation only indicates a statistical association between two variables, not a cause-and-effect relationship. Other factors or lurking variables might be responsible for the observed correlation.
What is an example given in the video to illustrate the error of assuming correlation implies causality?
-The example given is the correlation between the number of Nobel Prizes awarded in a country and the amount of chocolate consumed in that country. It is incorrect to assume that chocolate consumption causes Nobel Prizes or vice versa.
What is a lurking variable and how does it relate to the concept of correlation?
-A lurking variable is an unobserved or ignored third variable that may actually explain the correlation between two other variables. It suggests that the correlation observed might not be due to a direct relationship between the two variables in question.
Can you provide another example from the video where a lurking variable is responsible for the observed correlation?
-The video mentions a hypothetical correlation between ice cream consumption and crime rates, with the lurking variable being the weather. Warmer weather could lead to both increased ice cream consumption and higher crime rates, but it doesn't mean one causes the other.
Why should one be cautious about using data based on averages when examining correlations?
-Using averages can suppress individual variation within the data, potentially masking the true relationship between variables. It may lead to the false conclusion that there is a correlation when there isn't one in the original data set.
What is the importance of examining a scatter plot when analyzing correlations?
-Examining a scatter plot is crucial to identify any non-linear relationships between variables that might be missed by simply looking at the correlation coefficient (r value) and p-values. It provides a visual representation of the data, allowing for a better understanding of the actual relationship.
Why might the r value and p-value not fully represent the relationship between two variables?
-The r value and p-value only indicate the strength and significance of a linear relationship. They may not capture non-linear relationships, such as exponential, logarithmic, or polynomial relationships, which could provide a more accurate representation of the data.
What is the potential consequence of ignoring non-linear relationships when analyzing data?
-Ignoring non-linear relationships could lead to incorrect conclusions about the nature of the relationship between variables. This might result in misinterpretations or missed opportunities to understand the underlying dynamics of the data.
How can one ensure they are not missing any non-linear relationships when analyzing data?
-One should always visualize the data using scatter plots and consider additional statistical methods or models that can capture non-linear relationships, such as regression analysis with polynomial or other non-linear terms.
What is the final recommendation made in the video regarding the analysis of correlation?
-The video recommends not to assume correlation implies causation, not to use data based on averages, and to always examine scatter plots to ensure that non-linear relationships are not overlooked.
Outlines
🔗 Correlation ≠ Causation
The first paragraph of the script discusses the common misconception that correlation implies causality. It uses the example of Nobel Prizes and chocolate consumption to illustrate that just because two variables are correlated, it doesn't mean one causes the other. The script warns against assuming causality without evidence and introduces the concept of a lurking variable, which can explain the correlation between two seemingly unrelated variables. It also mentions the importance of having a simple random sample and the pitfalls of relying on averages, which can obscure individual variations and lead to incorrect conclusions about correlation.
📊 The Importance of Recognizing Non-linear Relationships
The second paragraph emphasizes the importance of not overlooking non-linear relationships when analyzing data. It cautions against relying solely on statistical measures such as the r-value, critical values of r, and p-values, which might suggest a linear relationship. The script advises to always examine the scatter plot of the data to identify any non-linear patterns that might exist between variables. It highlights that while statistical analysis can indicate a relationship, it may not always reveal the true nature of that relationship, which could be exponential, logarithmic, quadratic, or polynomial. The paragraph concludes by stressing the need to look beyond numerical analysis to fully understand the dynamics between correlated variables.
Mindmap
Keywords
💡Correlation
💡Causality
💡Lurking Variable
💡Ice Cream Consumption
💡Crime Rates
💡Averages
💡Nonlinear Relationship
💡Scatter Plot
💡R Value
💡P Value
Highlights
Correlation does not imply causation - just because two variables are correlated does not mean one causes the other.
Example: Nobel prize data shows correlation between chocolate consumption and Nobel prizes awarded, but no causal relationship.
Lurking variables may explain the correlation between two variables without a direct causal link.
Ice cream consumption and crime rates may be correlated due to a lurking variable like weather, not a direct causal relationship.
Avoid assuming correlation implies causality - correlation can only be used for prediction, not causation.
Using data based on averages can lead to false correlations by suppressing individual variation.
Computing means or averages can result in loss of original data variation, potentially masking true correlations.
Avoid using averages when trying to show correlation between variables - use original data instead.
Ignoring the possibility of non-linear relationships can lead to incorrect conclusions about the relationship between variables.
Scatter plots are important for examining potential non-linear relationships between variables.
R values and p-values may imply a linear relationship, but a non-linear relationship could provide more insight.
Variables may be related exponentially, logarithmically, quadratically, or through a polynomial function, not just linearly.
Always examine the scatter plot before drawing conclusions to ensure no non-linear relationships are missed.
Three common errors in correlation analysis: assuming causation, using averages, and ignoring non-linear relationships.
Remember to consider lurking variables, avoid false correlations from averages, and examine scatter plots for non-linear relationships.
Transcripts
Browse More Related Video
Elementary Statistics - Chapter 10 Correlation and Regression
10.1.3 Correlation - Testing a Claim of Correlation Using the Critical Value Method
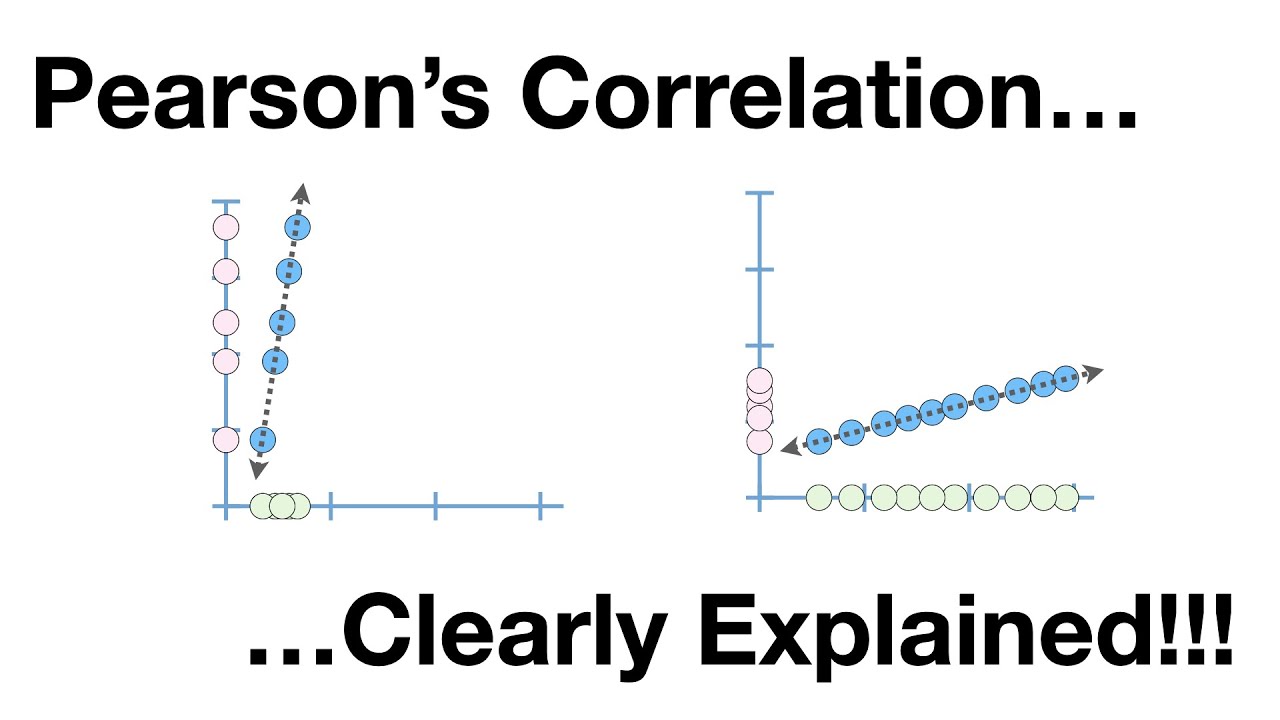
Pearson's Correlation, Clearly Explained!!!
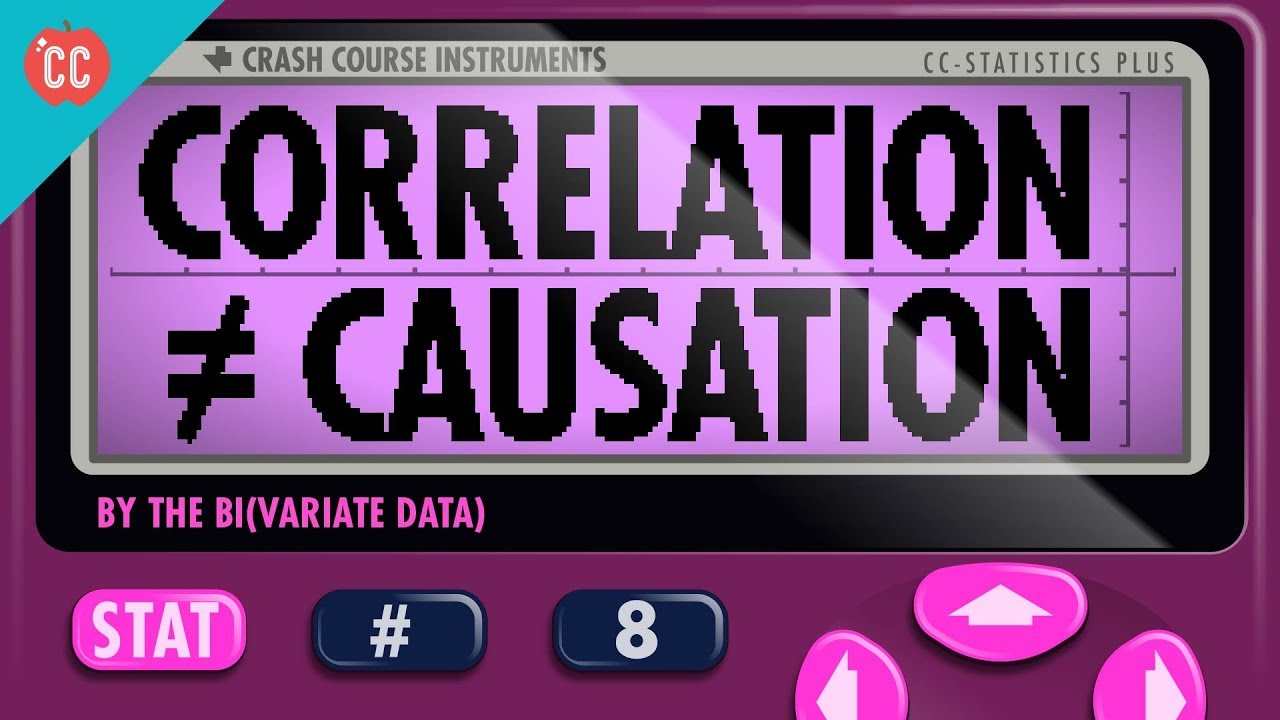
Correlation Doesn't Equal Causation: Crash Course Statistics #8
Explanatory and Response Variables, Correlation (2.1)
10.1.5 Correlation - Testing a Claim of Correlation Using the P-Value Method
5.0 / 5 (0 votes)
Thanks for rating: