10.1.5 Correlation - Testing a Claim of Correlation Using the P-Value Method
TLDRThis video tutorial explains how to conduct a hypothesis test for linear correlation between variables using the p-value method. It covers setting up null and alternative hypotheses, ensuring data meets requirements like simple random sampling and bivariate normal distribution. The process involves calculating the sample correlation coefficient (r), deriving the test statistic (t), and finding the p-value to make a statistical decision. The example demonstrates testing for a correlation between chocolate consumption and Nobel laureates, concluding with evidence of a positive correlation.
Takeaways
- 🔍 The video discusses conducting a hypothesis test using the p-value method to determine linear correlation between variables.
- 📝 The null hypothesis (H0) typically states that the linear correlation coefficient (rho) for the population is zero, implying no correlation.
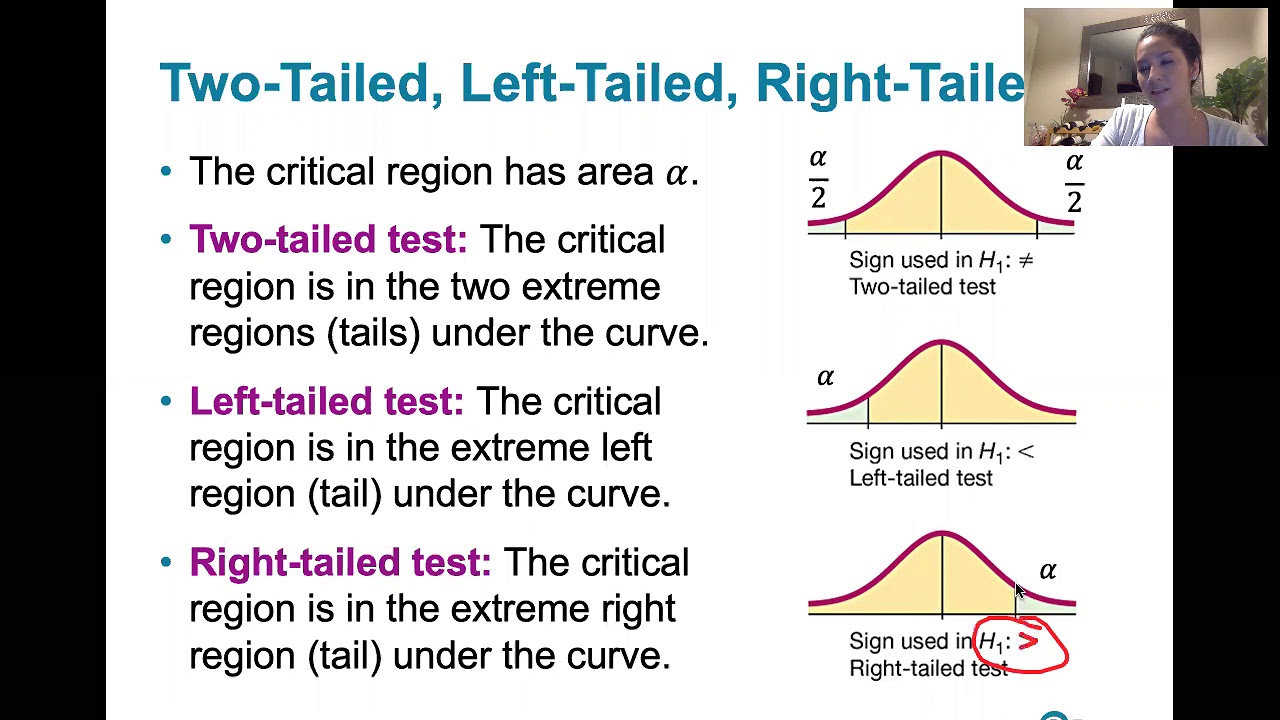
- 🔄 The alternative hypothesis (H1) can vary, suggesting either a positive or negative correlation, which means rho is not equal to zero.
- ⚠️ The video emphasizes that the requirements for testing linear correlation are the same as for the critical value method, including having a simple random sample of quantitative data.
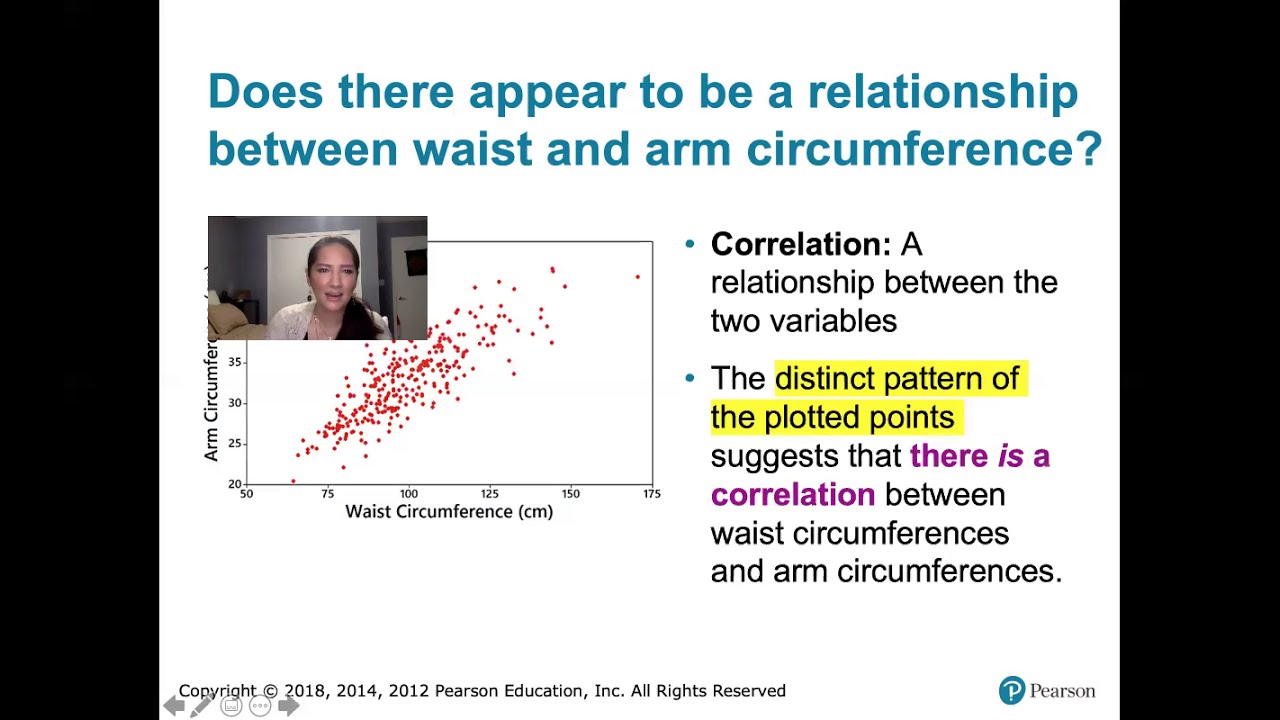
- 📈 It is important to check for a straight line pattern in the scatter plot of the data and the absence of outliers, which can affect the correlation.
- 📊 The assumption of bivariate normal distribution for the data is verified indirectly by ensuring the scatter plot shows a straight line pattern and no outliers.
- 🧭 The test statistic 't' is calculated using the formula involving the sample statistic 'r', and it follows a student t-distribution with n-2 degrees of freedom.
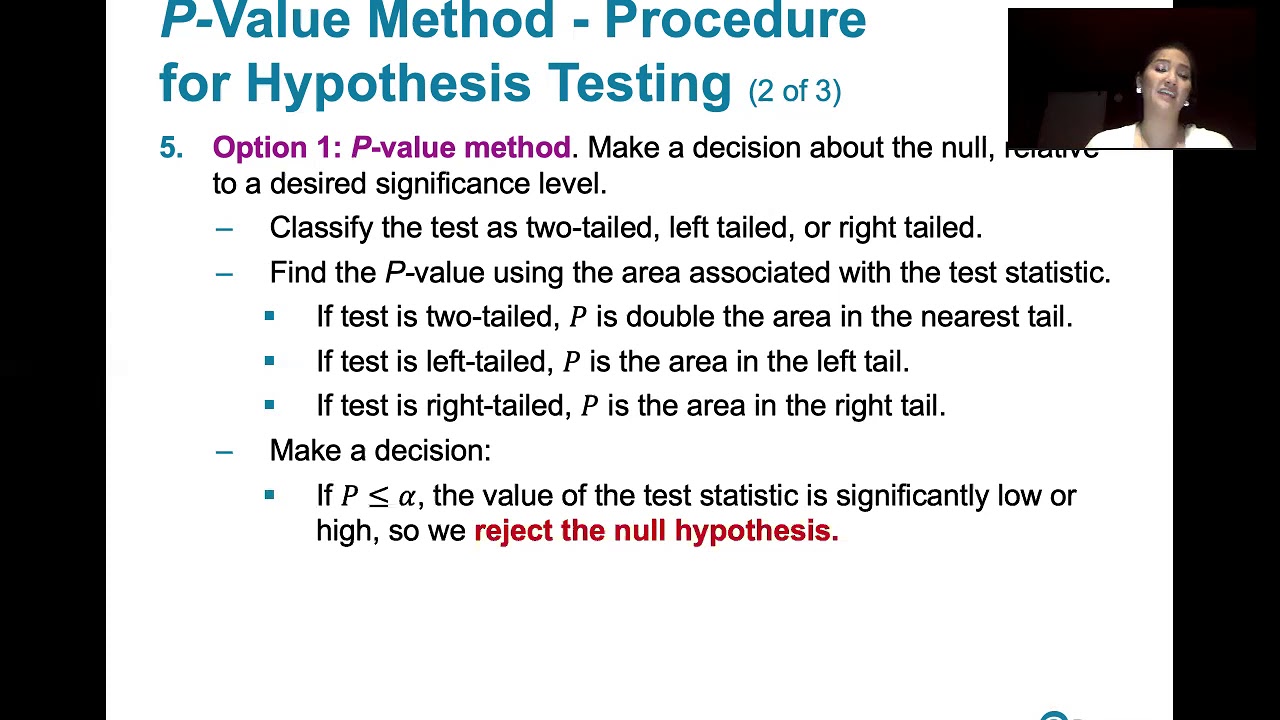
- 📊 The p-value is found by determining the area in the tails of the t-distribution beyond the calculated test statistic, typically for a two-tailed test.
- 🔑 The decision rule for the hypothesis test is based on the p-value: if p is low (lower than alpha), the null hypothesis is rejected, indicating evidence of correlation.
- 📚 The final conclusion should relate back to the original hypothesis about the correlation between two specific variables, such as chocolate consumption and Nobel laureates.
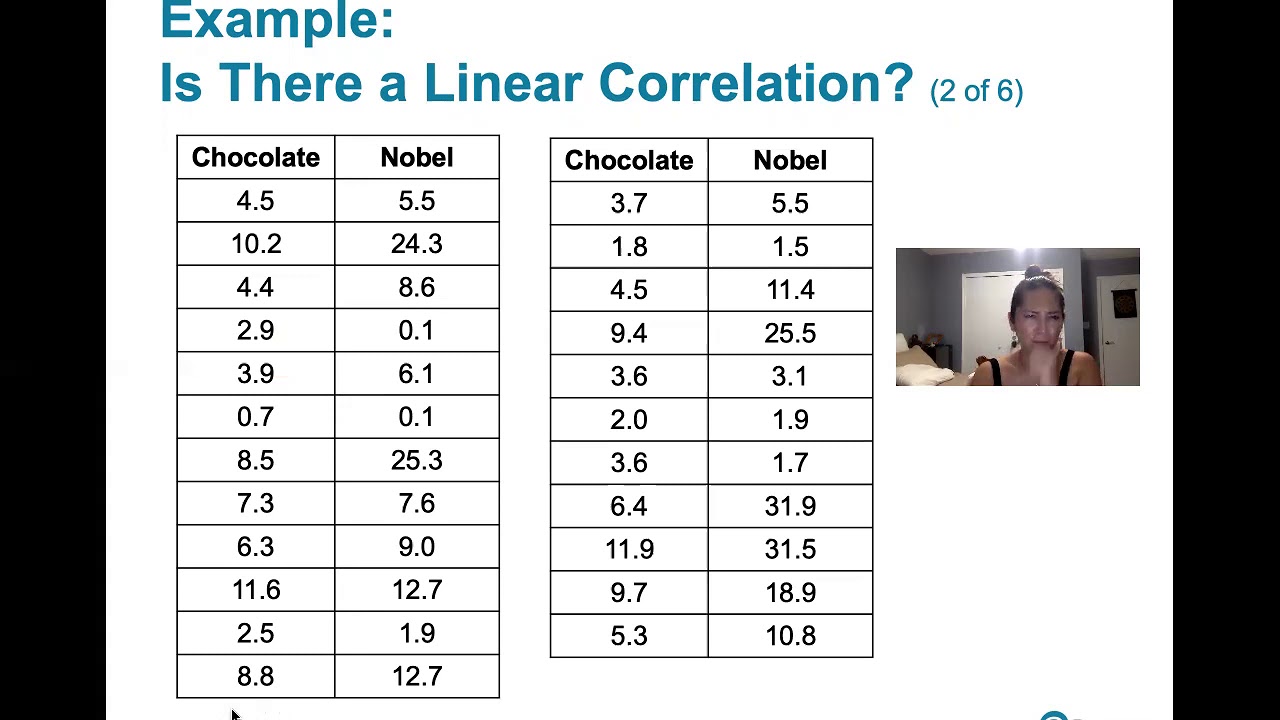
- 📋 The example in the video uses data on chocolate consumption and Nobel prizes to demonstrate the hypothesis testing process using the p-value method.
Q & A
What is the purpose of the video script?
-The video script discusses learning outcome number five from lesson 10.1, focusing on how to conduct a hypothesis test to determine if there is a linear correlation between variables using the p-value method.
What are the null and alternative hypotheses for testing correlation?
-The null hypothesis is that the linear correlation coefficient (rho) for the population is zero, indicating no correlation between the two variables. The alternative hypothesis is that rho is not equal to zero, suggesting a non-zero correlation between the variables.
Why might we use different alternative hypotheses for testing correlation?
-Different alternative hypotheses may be used to test for a specific type of correlation, such as a positive or negative correlation. This would turn the hypothesis test into a right-tailed or left-tailed test, respectively, instead of a two-tailed test.
What are the requirements for testing a claim of linear correlation between two variables?
-The requirements include having a simple random sample of quantitative data, the data should approximate a straight line pattern when plotted, and there should be no outliers or known errors that need to be addressed.
How does the assumption of bivariate normal distribution relate to the requirements for testing correlation?
-The assumption of bivariate normal distribution means that when one variable is held constant, the other variable has a normal distribution. In practice, this is verified by ensuring the data approximates a straight line and there are no outliers, which indirectly supports the assumption.
What is the test statistic 't' used for in the p-value method?
-The test statistic 't' is used to determine the p-value for the hypothesis test. It is derived from the sample statistic 'r' and follows a Student's t-distribution with n-2 degrees of freedom.
How is the test statistic 't' calculated for a correlation hypothesis test?
-The test statistic 't' is calculated using the formula: t = r / sqrt((1 - r^2) / (n - 2)), where 'r' is the sample correlation coefficient and 'n' is the sample size.
What does the p-value represent in the context of a hypothesis test?
-The p-value represents the probability of observing a test statistic as extreme or more extreme than the one calculated, assuming the null hypothesis is true. It is used to decide whether to reject the null hypothesis.
How do you interpret a low p-value in the context of a correlation hypothesis test?
-A low p-value, typically lower than the significance level (alpha), indicates there is sufficient evidence to reject the null hypothesis, suggesting a linear correlation between the variables.
Can you provide an example of how to use the p-value method with real data?
-The script provides an example using data on chocolate consumption and Nobel laureates. It guides through verifying requirements, calculating the correlation coefficient 'r', computing the test statistic 't', finding the p-value, and making a decision based on the p-value compared to the significance level.
Outlines
🔍 Hypothesis Testing for Linear Correlation
This paragraph introduces the concept of hypothesis testing to determine if there's a linear correlation between variables using the p-value method. It explains the null hypothesis (ρ=0, indicating no correlation) and alternative hypotheses (ρ≠0, suggesting some correlation). The paragraph also discusses the rare cases of testing for positive or negative correlations, turning the test into a one-tailed test. It outlines the requirements for testing, such as having a simple random sample of quantitative data, a scatter plot approximating a straight line, and the handling of outliers. The importance of checking for a bivariate normal distribution is mentioned, with practical checks suggested through scatter plot analysis. The paragraph concludes with an explanation of how to use technology to find the p-value and the test statistic 't', which is derived from the sample statistic 'r'.
📊 Understanding the P-Value and Test Statistic
The second paragraph delves into the specifics of calculating the p-value and the test statistic 't' for a hypothesis test on linear correlation. It describes the process of finding the p-value using the test statistic in a two-tailed test, which involves doubling the area in the tail opposite to the test statistic. The paragraph provides a step-by-step guide on using Excel functions like T.DIST.2T, T.DIST, and T.DIST.RT to find the p-value. It also explains how to interpret the p-value in the context of the null hypothesis, with a low p-value indicating evidence of correlation and a high p-value suggesting insufficient evidence to reject the null hypothesis. The paragraph includes an example using data on chocolate consumption and Nobel laureates, emphasizing the importance of meeting the testing requirements and providing a practical demonstration of calculating 'r' and the test statistic 't' in Excel.
📈 Computing the P-Value and Making Conclusions
The final paragraph focuses on the computation of the p-value and the subsequent decision-making process in a hypothesis test for linear correlation. It details the formula for the test statistic 't' and demonstrates its calculation in Excel. The paragraph explains how to find the p-value using the T.DIST.2T function in Excel and interprets the result, which should be compared against the significance level (alpha). A small p-value leads to the rejection of the null hypothesis, providing evidence of a linear correlation. The example from the previous paragraph is revisited, with the chocolate and Nobel laureate data used to illustrate the process. The paragraph concludes by emphasizing the consistency of results obtained using the p-value method with those from the critical value method previously discussed.
Mindmap
Keywords
💡Hypothesis Test
💡P-value Method
💡Null Hypothesis
💡Alternative Hypothesis
💡Linear Correlation Coefficient (Rho)
💡Bivariate Normal Distribution
💡Test Statistic (T)
💡Degrees of Freedom
💡Scatter Plot
💡Significance Level (Alpha)
💡Excel Functions
Highlights
The video discusses the p-value method for conducting a hypothesis test to determine linear correlation between variables.
Null and alternative hypotheses for correlation claims remain consistent with the critical value method.
The null hypothesis is that the linear correlation coefficient for the population is zero, indicating no correlation.
Alternative hypotheses can assert a non-zero, positive, or negative correlation, turning the test into one- or two-tailed.
Requirements for testing linear correlation include a simple random sample of quantitative data and a scatter plot approximating a straight line.
Outliers in the scatter plot, if known to be errors, should be removed; otherwise, compute with and without them.
Meeting the second and third requirements implies a bivariate normal distribution of the xy pairs.
The p-value method may use technology to provide the p-value or compute it using the test statistic t.
The test statistic t is derived from the sample statistic r and follows a student t-distribution.
The formula for t involves r, the square root of (1 - r^2), and the sample size minus 2.
For a two-tailed test, the p-value is the area in the tail beyond the test statistic, doubled.
Excel functions can be used to calculate the p-value and determine statistical significance.
A low p-value (< alpha) leads to the rejection of the null hypothesis, indicating evidence of correlation.
A high p-value (>= alpha) results in failing to reject the null, suggesting insufficient evidence for correlation.
The final answer should relate back to the original hypothesis about the correlation between two meaningful variables.
An example is provided using data on chocolate consumption and Nobel prizes to illustrate the hypothesis test.
The example checks the validity of the sample and the pattern in the scatter plot before proceeding with the test.
Excel is used to calculate the correlation coefficient r and the test statistic t for the hypothesis test.
The p-value obtained from the test statistic is compared to the significance level alpha to make a conclusion.
Transcripts
Browse More Related Video
10.1.3 Correlation - Testing a Claim of Correlation Using the Critical Value Method
8.2.1 Testing a Claim About a Proportion - P-value, Critical Value Methods, Normal Approximation
Ace Statistics Interviews: A Data-driven Approach For Data Scientists
9.1.2 Two Proportions - Example, P-Value Method, Normal Approximation to the Binomial Distribution
10.1.1 Correlation - Linear, Nonlinear, Positive Linear, and Negative Linear Correlation Defined
8.1.4 Basics of Hypothesis Testing - The Critical Value Method for a Population Proportion
5.0 / 5 (0 votes)
Thanks for rating: