10.1.3 Correlation - Testing a Claim of Correlation Using the Critical Value Method
TLDRThis video explains how to conduct a hypothesis test to determine if there's a linear correlation between two variables using the critical value method. It covers the null and alternative hypotheses, requirements for testing, and how to handle outliers. The video also demonstrates using technology and a critical values table to compare computed correlation coefficients with critical values, using a chocolate consumption and Nobel laureates dataset as an example. It emphasizes that correlation does not imply causation, merely indicating a relationship between variables.
Takeaways
- 🔍 The video discusses the hypothesis test for determining a linear correlation between two variables using the critical value method.
- ❌ The null hypothesis for correlation is always that there is no linear correlation, meaning the population linear correlation coefficient (ρ) is equal to zero.
- 🔄 The alternative hypothesis can be that there is a linear correlation (ρ ≠ 0), a positive correlation (ρ > 0), or a negative correlation (ρ < 0).
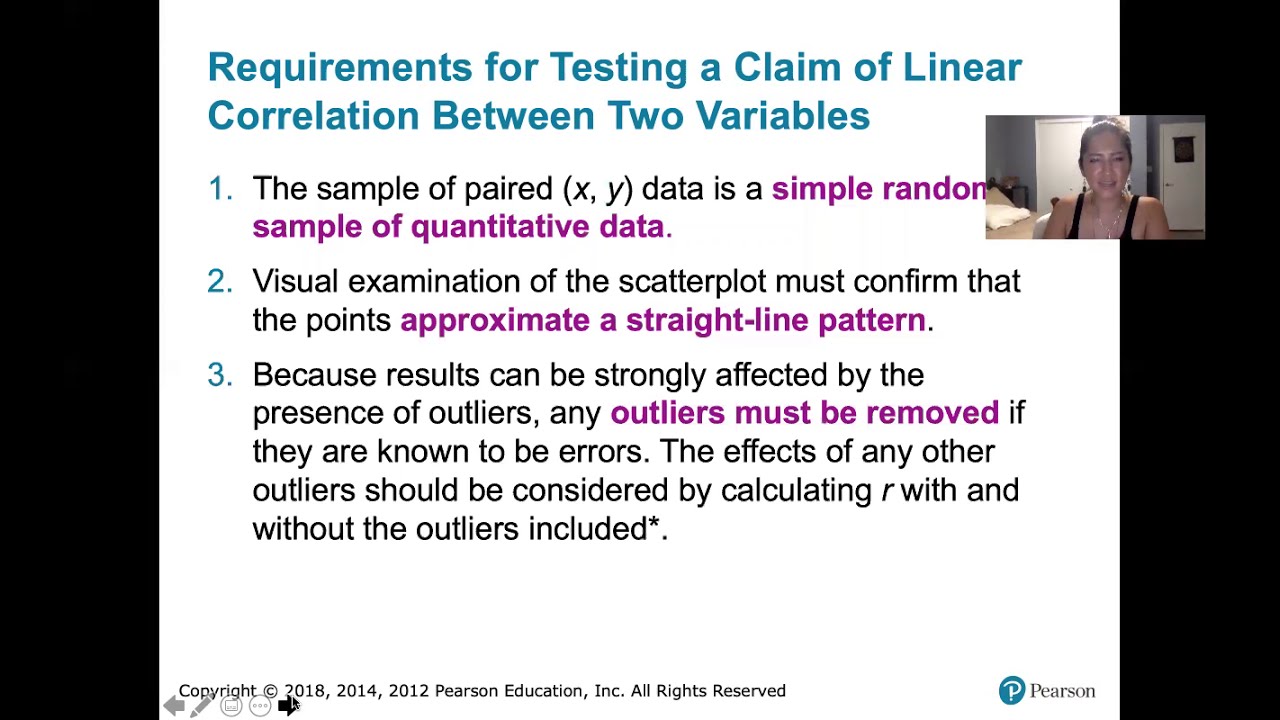
- 📊 Requirements for testing correlation include having a simple random sample of quantitative data, a scatter plot that approximates a straight line pattern, and removing known outliers.
- 📈 The presence of outliers can significantly affect the linear correlation coefficient (r), as they correspond to z-scores far from zero and can skew the results.
- 📚 The assumption of bivariate normal distribution is verified indirectly by ensuring the scatter plot shows a linear pattern and there are minimal outliers.
- 📉 The critical value method involves comparing the absolute value of the sample statistic r with critical values found in Table A5 or calculated using technology.
- 📝 A significant correlation is indicated if the absolute value of r is greater than the critical value, suggesting evidence against the null hypothesis of no correlation.
- 📉 The distribution of r is approximately normal when r is low but becomes more skewed as r increases.
- 📚 The video uses an example of the correlation between chocolate consumption and the number of Nobel laureates, with a sample size of 23 pairs of data.
- 🏅 The example concludes that there is sufficient evidence of a linear correlation between chocolate consumption and Nobel laureates, with an r value of approximately 0.801 exceeding the critical value.
Q & A
What is the purpose of the video script?
-The purpose of the video script is to discuss the process of conducting a hypothesis test to determine whether there is a linear correlation between two variables using the critical value method.
What are the null and alternative hypotheses for a correlation test?
-The null hypothesis (H0) is that there is no linear correlation, meaning the population linear correlation coefficient (ρ) is equal to zero. The alternative hypothesis (H1) is that there is a linear correlation, implying ρ is not equal to zero.
Can the alternative hypothesis specify the direction of the correlation?
-Yes, the alternative hypothesis can specify whether there is a positive or negative correlation, with ρ being greater than zero for a positive correlation and less than zero for a negative correlation.
What are the requirements for testing a claim of linear correlation between two variables?
-The requirements are: 1) The sample of paired data must be a simple random sample of quantitative data. 2) The scatter plot of the data must approximate a straight line pattern. 3) Outliers, if known to be errors, should be removed as they can significantly affect the correlation coefficient.
Why is it important to check for a straight line pattern in the scatter plot?
-Checking for a straight line pattern in the scatter plot is important because it verifies that the data has a bivariate normal distribution, which is a prerequisite for the correlation test to be appropriate.
How does the presence of outliers affect the value of the correlation coefficient (r)?
-Outliers affect the value of r because they correspond to z-scores that are far from zero, which can significantly skew the calculation of r, as r is calculated based on the product of z-scores for each pair of data points.
What is the critical value method used for in the context of this script?
-The critical value method is used to determine if there is sufficient evidence to support a claim of linear correlation by comparing the absolute value of the sample correlation coefficient (r) to critical values found in a table or provided by statistical software.
How do you determine if the critical value method provides evidence of a correlation?
-If the absolute value of the computed r is greater than the critical value, it provides evidence of a correlation. If it is less than the critical value, there is not sufficient evidence to support the claim of a linear correlation.
What is the significance of the correlation coefficient (r) values ranging between -1 and 1?
-The range of r values between -1 and 1 indicates the strength and direction of the linear relationship. Values close to 1 or -1 indicate a strong linear relationship, with positive or negative slopes, respectively, while values close to 0 indicate a weak or no linear relationship.
Can the video script's example of chocolate consumption and Nobel laureates imply a cause-and-effect relationship?
-No, the script makes it clear that finding a correlation between chocolate consumption and the number of Nobel laureates does not imply a cause-and-effect relationship. It only suggests that the two variables move together but does not explain why.
Outlines
🔍 Hypothesis Testing for Linear Correlation
This paragraph introduces the concept of hypothesis testing to determine the existence of a linear correlation between two variables using the critical value method. It explains the formulation of null and alternative hypotheses, emphasizing that the null hypothesis typically states no linear correlation (ρ=0), while the alternative suggests a non-zero correlation. The paragraph also touches on the conditions required for testing, such as the need for a simple random sample of quantitative data and the expectation of a linear pattern in the scatter plot of data points. Additionally, it mentions the impact of outliers on the correlation coefficient and the assumption of bivariate normal distribution for the data.
📊 Critical Value Method for Correlation Analysis
The second paragraph delves into the critical value method for testing the hypothesis of linear correlation. It describes the use of a table of critical values for the sample statistic 'r' and explains the significance of positive and negative critical values in relation to the alternative hypothesis. The paragraph highlights the process of comparing the absolute value of the computed correlation coefficient 'r' with the critical values to determine if there is sufficient evidence of a linear correlation. It also discusses the distribution of 'r' and its skewness at higher values, and the use of a visual representation to compare the critical and computed values of 'r'.
🌐 Data Analysis and Scatter Plot Interpretation
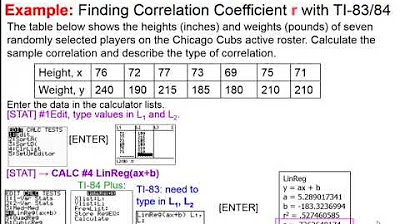
This paragraph focuses on the practical application of the critical value method using the example of chocolate consumption and the number of Nobel laureates. It discusses the importance of ensuring the data meets the criteria for hypothesis testing, including the examination of a scatter plot for a linear pattern and the absence of outliers. The paragraph provides a step-by-step guide on how to use Excel to calculate the linear correlation coefficient 'r' and to create a scatter plot, emphasizing the assumption of a simple random sample for the validity of the analysis.
📉 Determining Correlation with Critical Values
The fourth paragraph continues the analysis of the Nobel laureate data set, explaining the process of comparing the computed correlation coefficient 'r' with critical values obtained from technology or a table. It discusses the interpretation of these values in relation to the hypothesis test, where if 'r' exceeds the critical value, there is evidence of correlation. The paragraph also provides a detailed explanation of how to use Table A5 to find approximate critical values and the importance of rounding down to a smaller sample size for a more conservative test.
🏆 Correlation Evidence and Nobel Prizes
The final paragraph concludes the hypothesis testing by comparing the computed 'r' value of 0.801 with the critical value of 0.444, indicating sufficient evidence of a correlation between chocolate consumption and the number of Nobel laureates. It clarifies that this correlation does not imply causation and humorously reflects on the visual representation of a Nobel Prize, noting its resemblance to a gold-foil covered chocolate. The paragraph reinforces the method of using critical values to test for a correlation between variables.
Mindmap
Keywords
💡Hypothesis Test
💡Null Hypothesis
💡Alternative Hypothesis
💡Linear Correlation
💡Correlation Coefficient (rho)
💡Critical Value Method
💡Bivariate Normal Distribution
💡Outliers
💡Scatter Plot
💡Significance Level (alpha)
💡Pearson Correlation Coefficient
Highlights
The video discusses the hypothesis test for linear correlation using the critical value method.
Null hypothesis states no linear correlation exists, while the alternative suggests a non-zero correlation.
Alternative hypotheses can specify positive or negative correlations.
Requirements for testing include a simple random sample of quantitative data.
Scatter plot should show a straight line pattern to suggest linear correlation.
Outliers can significantly affect the correlation coefficient and should be considered.
Bivariate normal distribution is assumed for the data to perform the hypothesis test.
Critical values for the correlation coefficient are used to determine evidence of correlation.
Table A5 provides critical values for different sample sizes at specific alpha levels.
Positive and negative critical values are considered due to the two-sided nature of the alternative hypothesis.
The absolute value of the sample correlation coefficient is compared to the critical values.
If the absolute value of r exceeds the critical value, there is evidence of correlation.
The distribution of r is normally distributed at lower values but becomes skewed at higher values.
An example using Nobel laureate data and chocolate consumption is provided to illustrate the process.
The example demonstrates calculating the correlation coefficient and comparing it to critical values.
The video concludes that there is sufficient evidence of a linear correlation between chocolate consumption and Nobel laureates based on the example data.
It is emphasized that correlation does not imply causation.
The process is simple once the requirements are met and the correlation coefficient is calculated.
Transcripts
Browse More Related Video
10.1.5 Correlation - Testing a Claim of Correlation Using the P-Value Method
Elementary Statistics - Chapter 10 Correlation and Regression
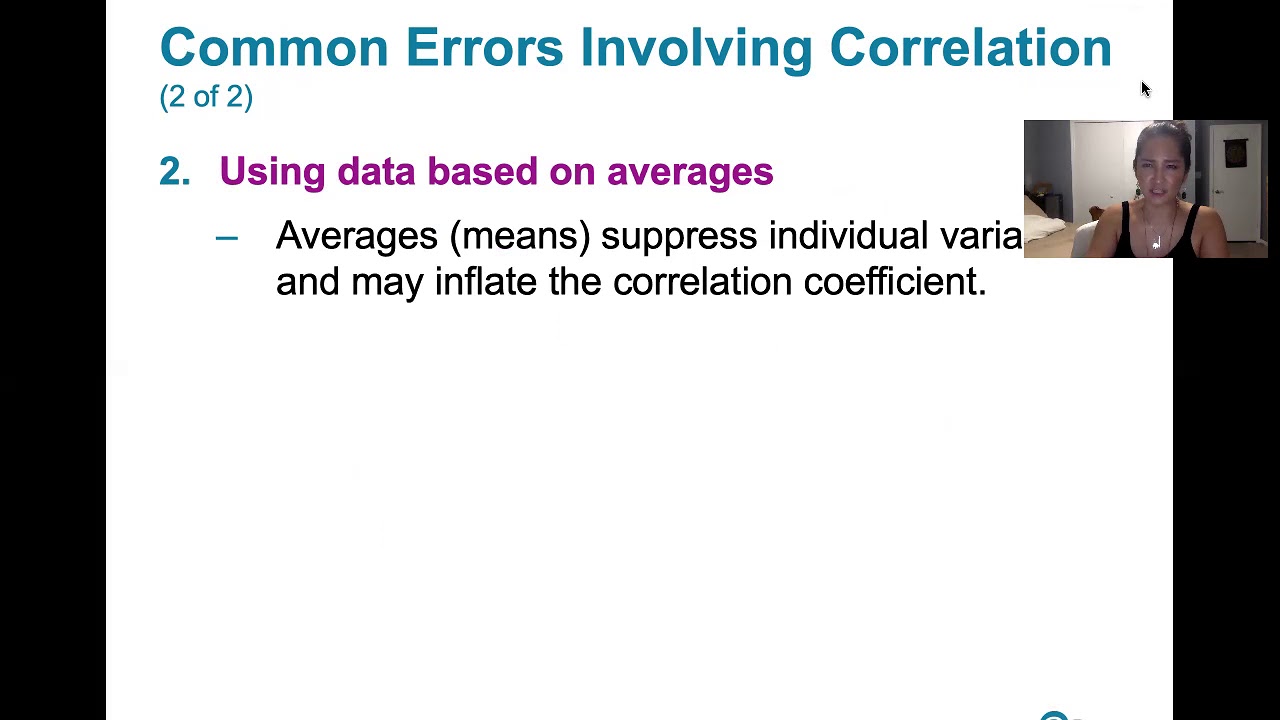
10.1.4 Correlation - Three Common Errors Involving Correlation
Pearson's Correlation, Clearly Explained!!!
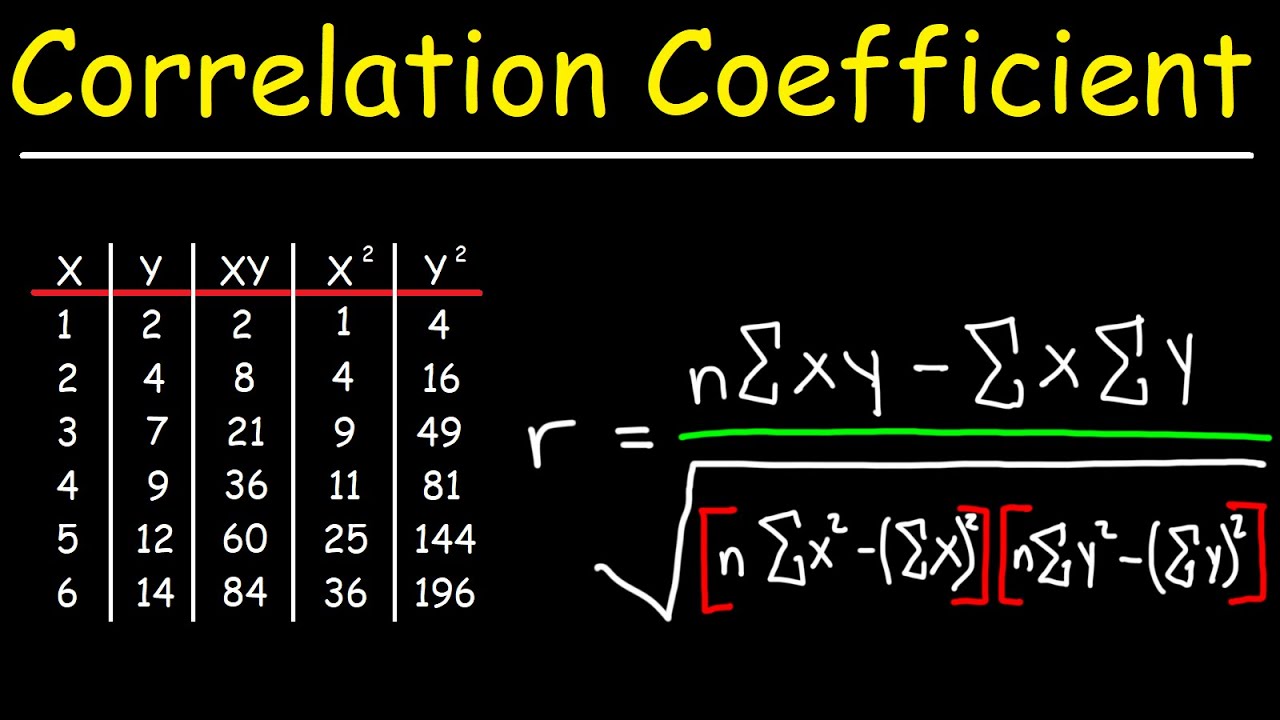
Correlation Coefficient
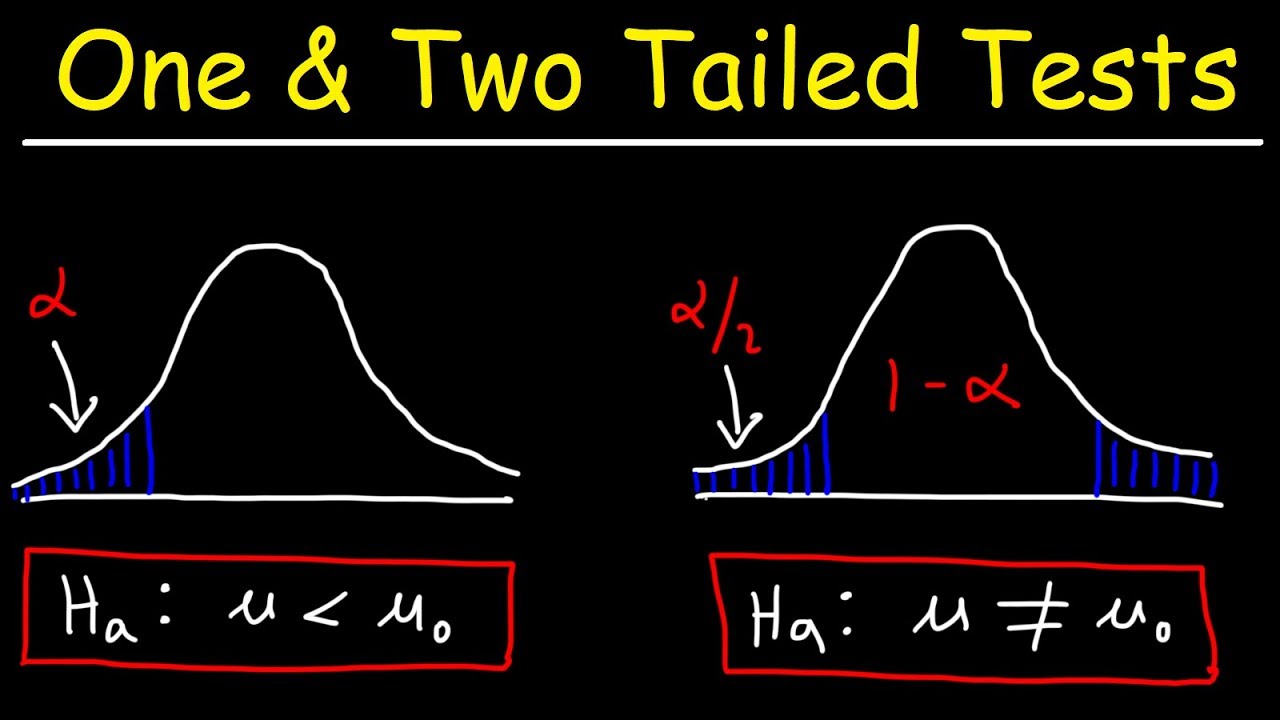
One Tailed and Two Tailed Tests, Critical Values, & Significance Level - Inferential Statistics
5.0 / 5 (0 votes)
Thanks for rating: