Pearson's Correlation, Clearly Explained!!!
TLDRThis video script from StatQuest dives into the concept of correlation, explaining how it measures the strength and direction of the relationship between two sets of data. It clarifies that correlation values range from -1 to 1, with -1 indicating a perfect negative linear relationship and 1 indicating a perfect positive linear relationship. The script also emphasizes that while correlation can suggest a trend, it does not imply causation. It discusses how confidence in correlation predictions increases with more data and a smaller p-value, highlighting the importance of data quantity and quality in statistical analysis.
Takeaways
- 😀 Correlation measures the strength and direction of the relationship between two variables, represented by data on the x-axis and y-axis.
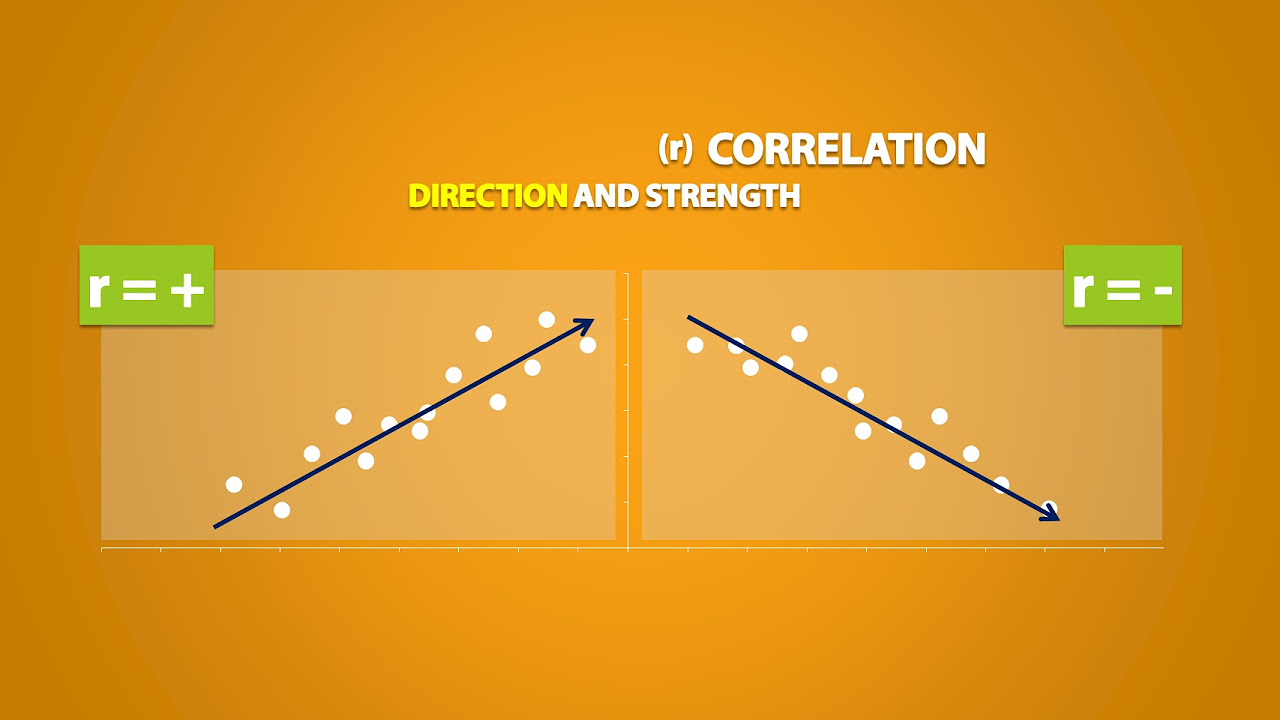
- 🔍 A positive correlation indicates that as one variable increases, the other also tends to increase, while a negative correlation suggests an inverse relationship.
- 📈 The correlation coefficient ranges from -1 to 1, with 1 indicating a perfect positive linear relationship, -1 indicating a perfect negative linear relationship, and 0 indicating no linear relationship.
- 📊 Correlation does not imply causation; it only suggests a trend that can be used for predictions and inferences.
- 📉 The closer data points are to the trendline, the stronger the relationship and the more confident we can be in our predictions.
- 📚 The strength of the correlation is quantified by the correlation coefficient, which is independent of the data's scale.
- 🤔 Small datasets can show high correlation values but should not be trusted as much due to the low probability that such a pattern is not due to random chance.
- 📝 The p-value in correlation analysis indicates the probability that the observed correlation could have occurred by random chance, with smaller p-values indicating stronger confidence in the correlation.
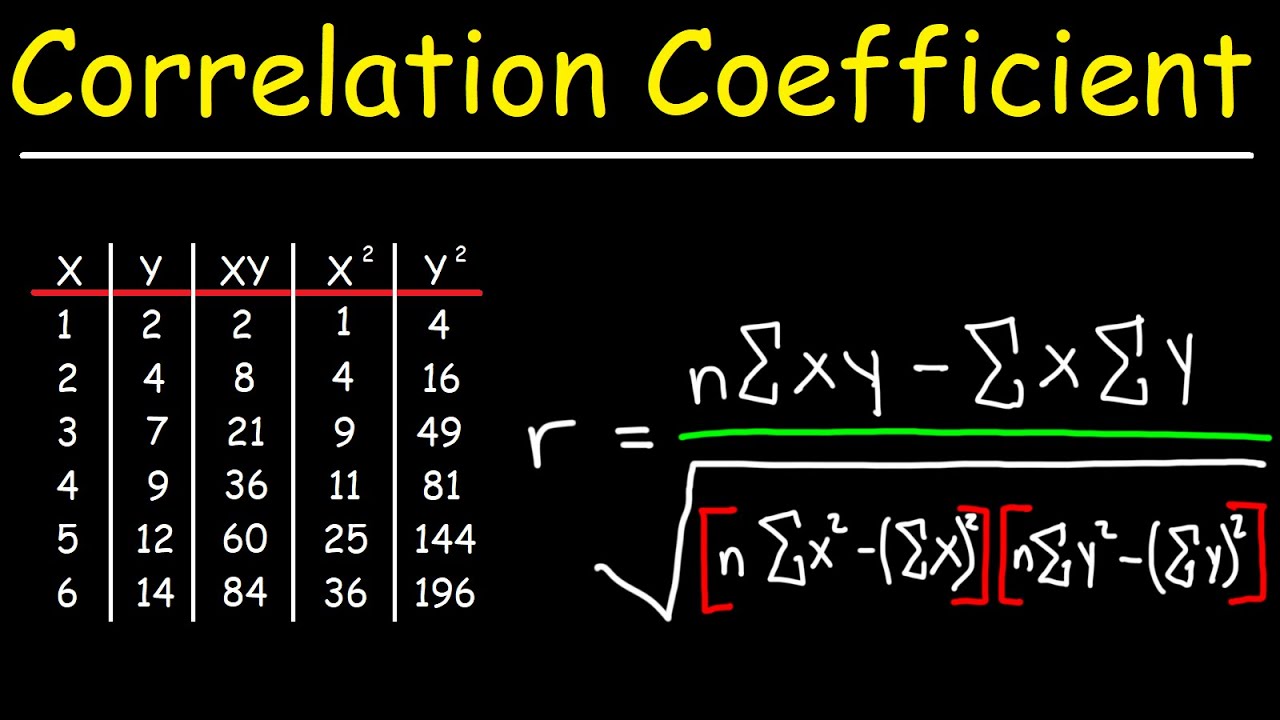
- 🔢 Calculating the correlation involves dividing the covariance of the two variables by the product of their standard deviations, which normalizes the value between -1 and 1.
- 📉 R-squared, which is related to the correlation coefficient, provides a measure of how well the variance in one variable predicts the variance in another, offering a more intuitive understanding of the strength of the relationship.
- 👉 Confidence in correlation-based predictions increases with the amount of data and the associated p-value, highlighting the importance of data quantity and quality in statistical analysis.
Q & A
What is the main topic of the video script?
-The main topic of the video script is the concept of correlation and how it measures the strength and direction of the relationship between two variables.
What is the difference between a strong and a weak correlation?
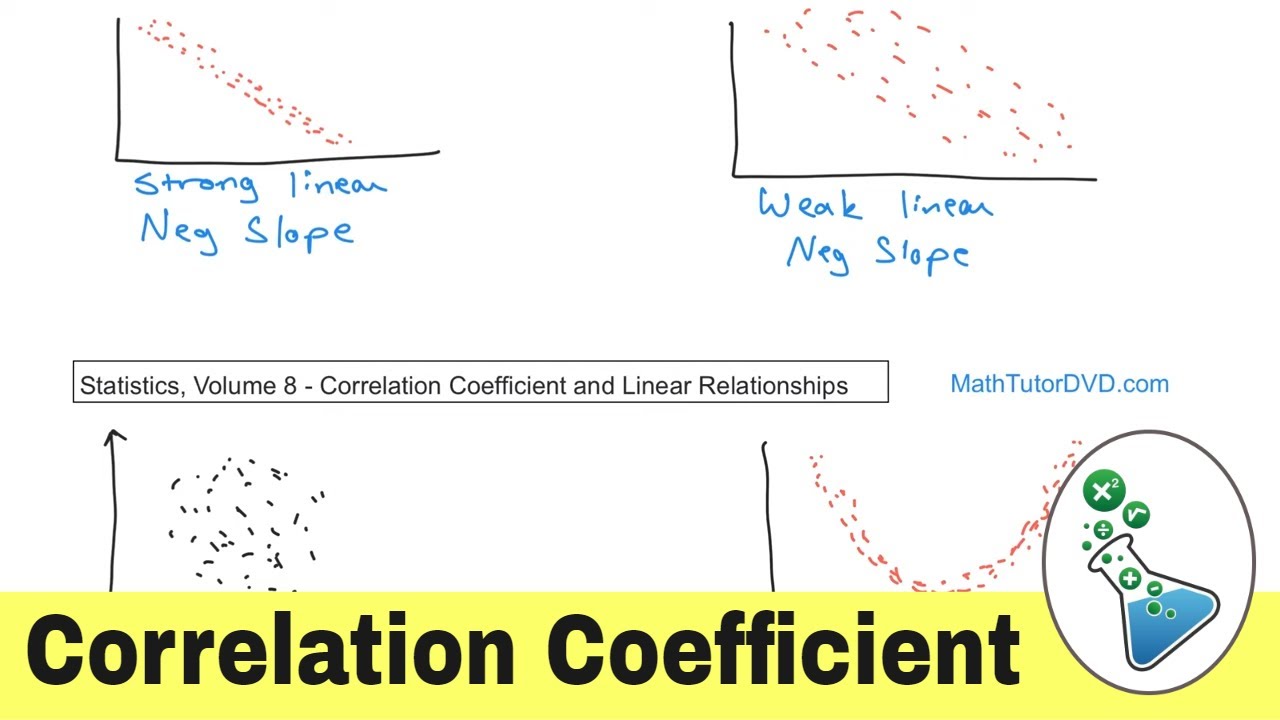
-A strong correlation indicates that the data points closely follow a straight line with either a positive or negative slope, while a weak correlation suggests that the data points are more scattered and do not follow a clear linear trend.
How does the video script explain the relationship between gene X and gene Y using grocery stores?
-The script uses the analogy of grocery stores to explain the relationship between gene X and gene Y. It suggests imagining the number of green apples as gene X and the number of red apples as gene Y, with each pair representing a single grocery store.
What does the slope of the line in a scatter plot represent in terms of correlation?
-The slope of the line in a scatter plot represents the direction of the relationship between the two variables. A positive slope indicates a positive correlation, while a negative slope indicates a negative correlation.
What is the maximum value for correlation and what does it signify?
-The maximum value for correlation is 1, which signifies a perfect positive linear relationship between the two variables, meaning that as one variable increases, the other also increases in a perfectly predictable manner.
Why does the script mention that correlation does not depend on the scale of the data?
-The script mentions that correlation does not depend on the scale of the data because it is a standardized measure that ranges from -1 to 1, making it scale-independent and allowing for easy comparison across different datasets.
How does the script explain the concept of a p-value in the context of correlation?
-The script explains that a p-value in correlation quantifies the probability that randomly drawn data points would result in a similarly strong or stronger relationship. A smaller p-value indicates that there is less likelihood that the observed correlation is due to random chance.
What does the script suggest about the relationship between the amount of data and the confidence in correlation?
-The script suggests that the more data points you have, the more confidence you can have in the correlation. This is because the probability of randomly drawn points forming a straight line decreases with each additional point, making the observed correlation more reliable.
How does the script differentiate between a correlation of 0 and a correlation of 1 or -1?
-A correlation of 0 indicates no linear relationship between the variables, meaning that knowing the value of one variable does not provide any information about the other. In contrast, a correlation of 1 or -1 indicates a perfect linear relationship, either positively or negatively, with a strong predictive power.
What is the role of R-squared in relation to correlation as mentioned in the script?
-R-squared, which is related to correlation, helps to quantify the strength of the relationship in a way that is easier to interpret. It provides a measure of how well the variance in one variable can be explained by the variance in another variable.
Why does the script emphasize the importance of the amount of data and the p-value in correlation analysis?
-The script emphasizes the importance of the amount of data and the p-value because they are crucial for determining the reliability and confidence in the correlation analysis. A larger dataset and a smaller p-value generally lead to more reliable and confident inferences.
Outlines
🔍 Introduction to Correlation and Data Relationships
The video script begins with an introduction to the concept of correlation, presented by Josh Starburns of Stack Quest. It emphasizes the importance of understanding relationships between data points plotted on an x-axis and a y-axis, using the analogy of mRNA transcripts from genes in different cells. The script explains how data points can be visualized on a graph, with low values of one gene correlating with low values of another, and high values correlating similarly. A positive linear trend is introduced, and the concept of using this trend to make predictions about gene Y given a value for gene X is explored. The script clarifies that correlation does not imply causation but is a tool for making educated guesses based on observed data trends.
📊 Correlation Strength and Predictive Confidence
This paragraph delves into the quantification of the strength of relationships using correlation values. It explains that a correlation of 1 indicates a perfect positive linear relationship, where all data points can be represented by a straight line with a positive slope. The script discusses how the scale of the data does not affect correlation and uses the example of grocery stores with green and red apples to illustrate the concept. It also addresses the importance of data quantity in correlation analysis, pointing out that with more data points, the confidence in predictions increases, and the correlation is less likely to be a result of random chance. The paragraph introduces the concept of p-values to quantify the confidence in the correlation's significance.
📉 Negative Correlation and Its Implications
The script continues by discussing negative correlation, where a negative slope indicates an inverse relationship between the variables. It explains that a correlation of -1 signifies a perfect negative linear relationship, where high values of one variable correspond to low values of another. The confidence in predictions based on negative correlation, quantified by p-values, is also dependent on the amount of data collected. The script reinforces the idea that correlation values close to -1 or 1 indicate strong relationships, while values closer to zero suggest weaker relationships, and a correlation of zero indicates no linear relationship.
🔢 Calculating Correlation and Interpreting Results
This paragraph explains the mathematical process of calculating correlation, which involves the covariance of the two variables divided by the product of their standard deviations. It clarifies that correlation values range from -1 to 1, with the scale of the data not affecting the correlation coefficient. The script provides an example calculation and discusses how the correlation coefficient squeezes the covariance into a standardized range. It also touches on the concept of R-squared as a related metric that helps in interpreting the strength of relationships more intuitively. The paragraph concludes by summarizing the key points about correlation: it quantifies the strength and direction of linear relationships, and confidence in these relationships is based on data quantity and p-values.
Mindmap
Keywords
💡Correlation
💡Covariance
💡Data Points
💡Trendline
💡Slope
💡P-value
💡Variance
💡R-squared
💡Confidence
💡Random Chance
Highlights
Introduction to the concept of relationships between data on the x-axis and y-axis using mRNA transcripts as an example.
Explanation of how data points can be represented and the use of a trend line to predict values.
The importance of the proximity of data to the trendline in determining the strength of the relationship between variables.
Correlation as a measure to quantify the strength of the relationship between data sets.
The maximum correlation value of 1 and its representation of a perfect positive linear relationship.
Correlation's independence from the scale of data and its focus on the relationship between variables.
The significance of the number of data points in establishing confidence in correlation predictions.
The concept of p-value in correlation and its role in determining the likelihood of a relationship occurring by chance.
The difference between correlation values of -1 and 1, representing the strongest linear relationships with negative and positive slopes, respectively.
How correlation values closer to zero indicate a weaker linear relationship or a poor fit of the data to a straight line.
The role of sample size and p-value in increasing confidence in correlation inferences.
The calculation of correlation using covariance and variance, and its normalization to a scale from -1 to 1.
The interpretation of correlation values and the challenges in understanding their implications for prediction accuracy.
Introduction to R-squared as a related metric that helps in better understanding the strength of relationships.
The summary of correlation as a tool for quantifying the strength of linear relationships and its dependence on data quantity and quality.
The final note on the practical applications of correlation in making inferences and predictions, emphasizing the importance of data quantity and p-value.
Transcripts


5.0 / 5 (0 votes)
Thanks for rating: