Explanatory and Response Variables, Correlation (2.1)
TLDRThis video script delves into the concepts of explanatory and response variables, and their relationship through correlation. It explains how a time plot and scatter plot can be used to visualize the relationship between two variables. The script further clarifies that while the x-axis typically represents the explanatory variable and the y-axis the response variable, both can be interchanged if the variables are not dependent. The concept of correlation, denoted as 'r', is introduced to measure the direction and strength of the linear relationship between two quantitative variables. The script elucidates that a positive or negative 'r' value indicates the direction of the slope, while values close to 1 or -1 signify a strong linear relationship. It emphasizes the importance of using the correlation formula for precise calculation rather than relying solely on visual interpretation from scatter plots, which can be deceiving due to different scales.
Takeaways
- 📊 Exploratory data analysis involves examining relationships between variables using various plots like histograms, stem plots, and box plots.
- 🔄 Back-to-back stem plots and side-by-side box plots are useful for comparing two different populations regarding the same variable.
- 📈 Time plots and scatter plots are utilized to illustrate the relationship between two variables, with the explanatory variable typically on the x-axis and the response variable on the y-axis.
- 🌳 Example given in the script: The age of a tree (explanatory variable) explains its height (response variable) as trees grow taller with age.
- 🔄 The terms 'explanatory variable' and 'response variable' can be interchanged with 'independent variable' and 'dependent variable' respectively.
- 📊 Scatter plots do not necessarily depict time; they display the values of two quantitative variables measured from the same population.
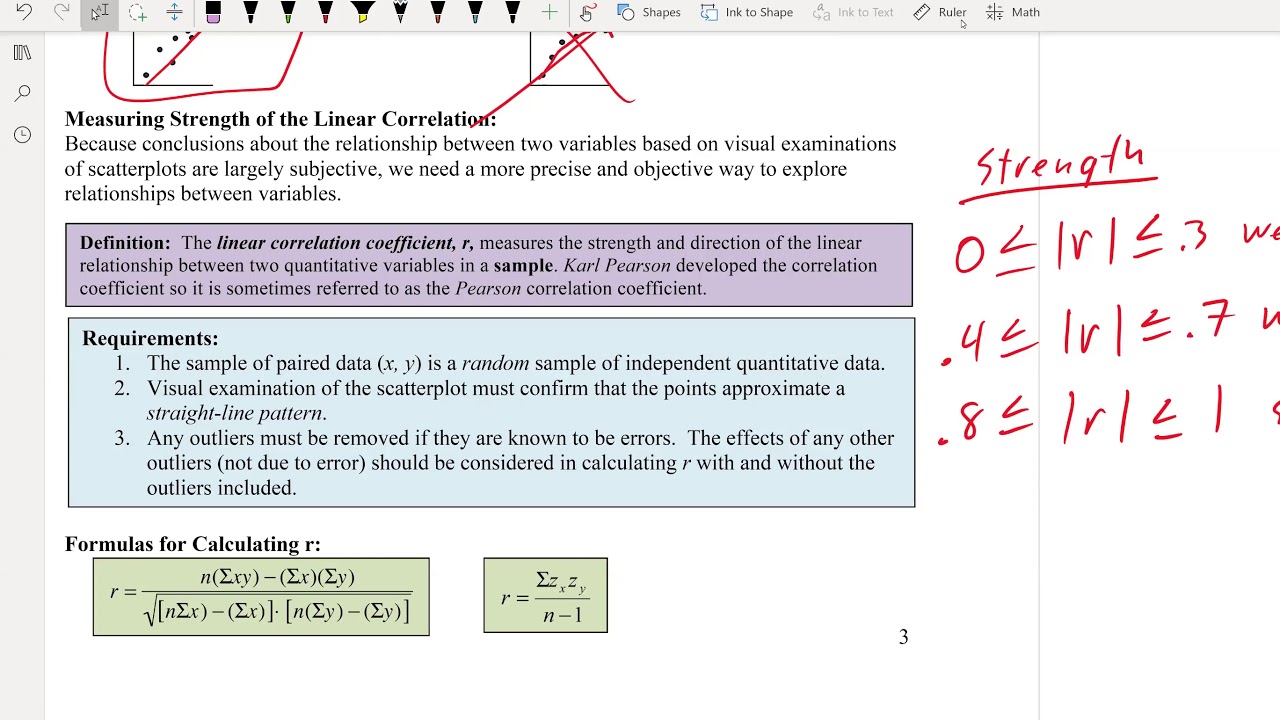
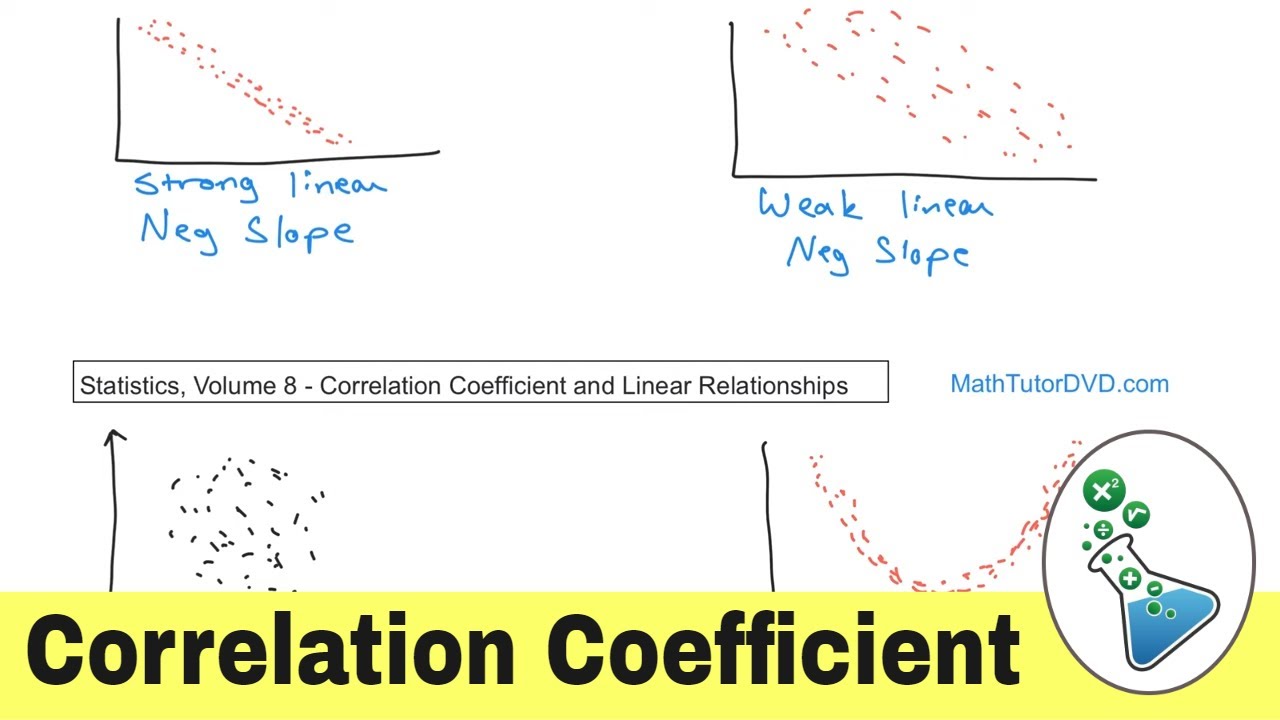
- 🎯 Correlation, denoted as 'r', indicates the direction and strength of a linear relationship between two quantitative variables and is represented using scatter plots.
- ⏫ For a perfect positive correlation, r equals positive one, and for a perfect negative correlation, r equals negative one, both indicating a perfect linear relationship.
- 🚫 The absence of a linear relationship is denoted by r equaling zero, meaning there is no correlation between the variables.
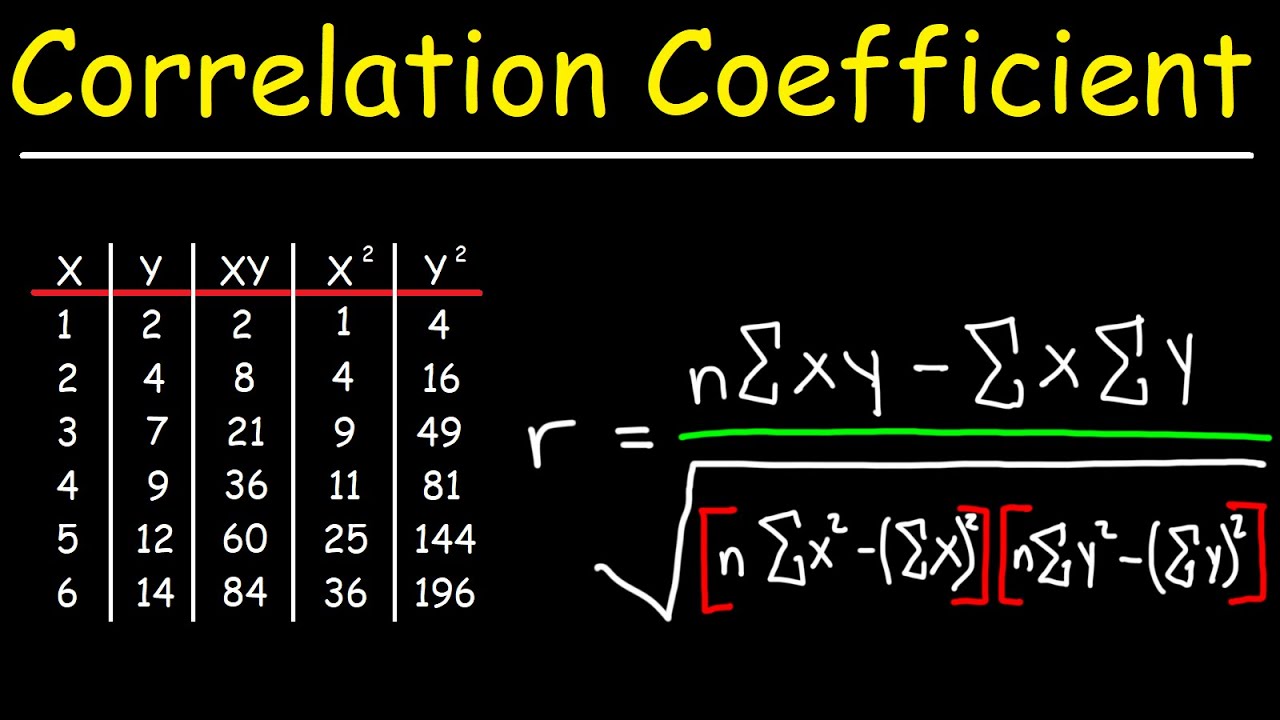
- 🧮 Calculating correlation involves a specific formula that takes into account the means, standard deviations, and the covariance of the variables.
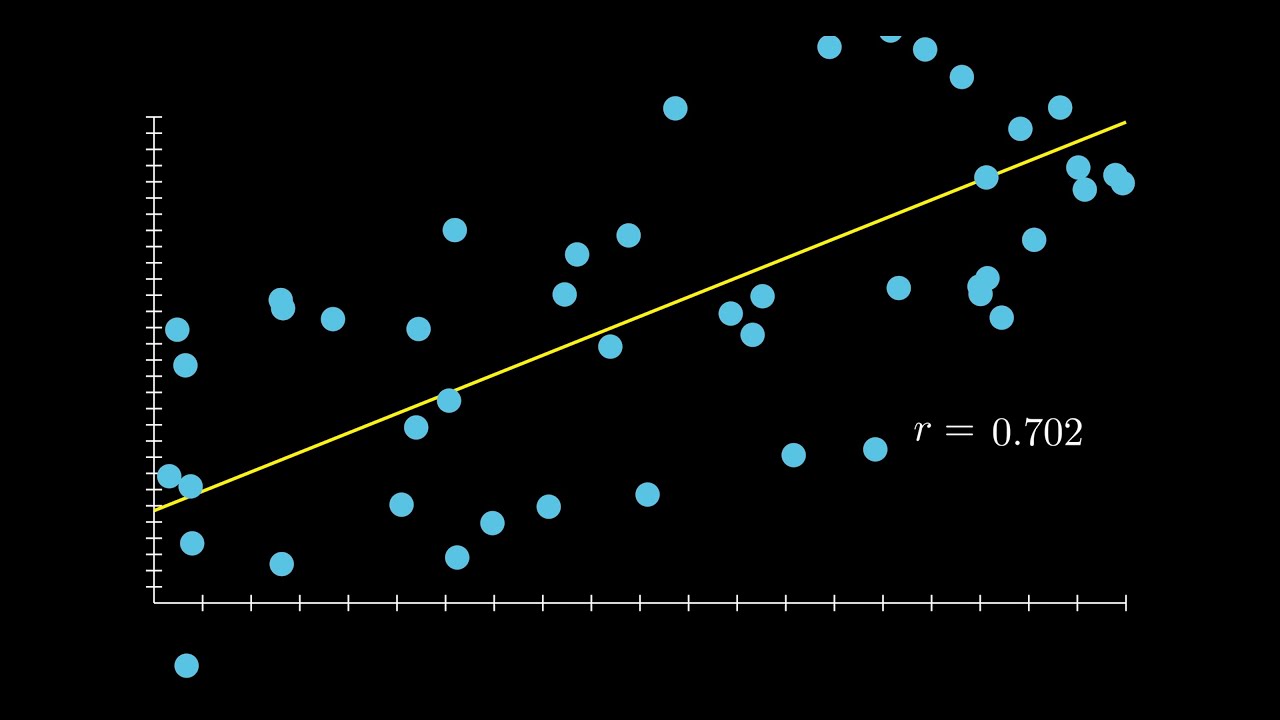
- 🧐 Visual interpretation of correlation can be misleading; numerical calculation is necessary for accurate determination of r, regardless of the graph's scale.
Q & A
What are the main components discussed in the video?
-The main components discussed in the video are explanatory variables, response variables, and correlation, along with various plots like histograms, stem plots, box plots, time plots, and scatter plots.
How do you use histogram, stem plots, and box plots to describe one variable?
-Histograms, stem plots, and box plots are used to describe the distribution, range, and central tendency of a single variable by providing a visual representation of the data points.
What is the difference between a time plot and a scatter plot when showing the relationship between two variables?
-A time plot is used to show the relationship between two variables when there is a temporal aspect involved, with one variable being the response and the other being the explanatory. A scatter plot, on the other hand, does not require time on the x-axis and shows the values of two quantitative variables from the same population.
Why are explanatory and response variables important in data analysis?
-Explanatory and response variables are important because they help in understanding the cause-and-effect relationship between variables, where the explanatory variable is believed to influence the outcome measured by the response variable.
How is the relationship between two variables represented in a scatter plot?
-In a scatter plot, each dot represents an individual data point, with the x-axis typically representing the explanatory variable and the y-axis representing the response variable. The pattern of the dots indicates the nature of the relationship between the two variables.
What does the correlation coefficient (r) measure?
-The correlation coefficient (r) measures the direction and strength of a linear relationship between two quantitative variables. It ranges from -1 to 1, with values close to 1 or -1 indicating a strong linear relationship, and a value of 0 indicating no linear relationship.
What are the perfect positive and perfect negative correlations?
-A perfect positive correlation occurs when there is an upward slope and the data points follow a perfect straight line, with r equal to positive one. A perfect negative correlation occurs when there is a downward slope and the data points follow a perfect straight line, with r equal to negative one.
How do you calculate the correlation coefficient (r)?
-The correlation coefficient (r) is calculated using a formula that involves finding the means, standard deviations, and the sum of the product of the differences between each data point and their respective means. The formula is: r = [Σ((x - x̄)(y - ȳ))] / (sx * sy * √[n])
Why is it important to be cautious when interpreting correlation just by looking at a scatter plot?
-Interpreting correlation just by looking at a scatter plot can be misleading because the visual appearance of the plot can be deceiving. The actual value of r should be calculated and interpreted, as it provides a numerical measure of the relationship, which is not always apparent from visual inspection.
What happens when there is no explanatory or response variable in a data set?
-When there is no explanatory or response variable, it means that the two variables are unrelated, and one does not explain the other. In such cases, the position of each variable on the graph does not matter, and the focus is usually on comparing the distributions of the two variables.
How can different scales on a scatter plot affect the perception of the correlation strength?
-Different scales on a scatter plot can affect the perception of the correlation strength because the visual density of the data points can make it seem like there is a stronger or weaker relationship than there actually is. This is why it's crucial to rely on the calculated value of r rather than just visual assessment.
Outlines
📊 Exploratory Data Analysis: Explaining Variables and Correlation
This paragraph introduces the concepts of explanatory and response variables in the context of data analysis. It explains how a time plot can be used to show the relationship between two variables, with one being the explanatory variable and the other the response variable. The example given is the age of a tree explaining its height. The paragraph also introduces scatter plots as another method to show the relationship between two variables and explains the convention of plotting the explanatory variable on the x-axis and the response variable on the y-axis. The concept of correlation, denoted as 'r', is introduced as a measure of the direction and strength of the linear relationship between two quantitative variables. The paragraph concludes by noting that correlation can be determined without explicitly identifying explanatory or response variables.
📐 Calculating Correlation: Methodology and Interpretation
This paragraph delves into the process of calculating correlation, using a formula that may seem complex but is easier than it appears. It provides a step-by-step guide on how to calculate the correlation coefficient 'r', starting with the creation of a table corresponding to the formula. The steps include calculating the means for the x and y values, finding the differences from the means, and multiplying these differences. The sum of these products is then used in the formula along with the standard deviations of each variable to compute the value of 'r'. The paragraph emphasizes the importance of using numerical values rather than relying on visual interpretation from scatter plots, as the latter can be deceptive. It concludes with an example calculation where 'r' is found to be positive 0.6, indicating a positive upward direction in the data.
Mindmap
Keywords
💡Explanatory Variables
💡Response Variables
💡Correlation
💡Scatter Plots
💡Time Plots
💡Histogram
💡Stem Plots
💡Box Plots
💡Independent Variable
💡Dependent Variable
💡Linear Relationship
💡Correlation Coefficient (r)
Highlights
Explanatory variables and response variables are key concepts in understanding the relationship between two variables.
Correlation is a statistical measure that describes the direction and strength of a linear relationship between two quantitative variables.
In a time plot, one variable is considered the response variable, measuring the outcome of a study, while the other is the explanatory variable, explaining the outcome.
A scatter plot is an alternative to a time plot for showing the relationship between two variables and does not require time on the x-axis.
The explanatory variable is typically plotted on the x-axis and is denoted as x, while the response variable is plotted on the y-axis and denoted as y.
It is possible to not have an explanatory or response variable, such as in comparing unrelated events like football and basketball scores.
Correlation is denoted as 'r' and can range from -1 to 1, with positive 1 indicating a perfect positive correlation and negative 1 indicating a perfect negative correlation.
A correlation value of zero means there is no linear relationship between the variables.
The strength of the linear relationship increases as the correlation value gets closer to either positive 1 or negative 1.
Correlation can be calculated using a specific formula that involves the means, standard deviations, and the covariance of the variables.
Creating a table to organize the data can facilitate the calculation of correlation.
Visual interpretation of correlation from a scatter plot can be misleading, and numerical calculation is necessary for accurate determination.
Different scales on the axes of scatter plots can affect the visual perception of the correlation strength.
The age of a tree is used as an example of an explanatory variable, as it can explain the height of the tree.
Studying hours and test scores are used as an example to demonstrate how to calculate the correlation between two variables.
The concept of correlation is crucial in statistical analysis for determining the nature of relationships between variables.
Transcripts


5.0 / 5 (0 votes)
Thanks for rating: