Density Curves and their Properties (5.1)
TLDRThis educational video delves into the concept of density curves, their properties, and their advantages over histograms. It explains how to transform frequency distributions into relative frequency distributions and emphasizes the importance of the total area under a density curve equating to one. The video also highlights the utility of density curves in visualizing large datasets and making statistical approximations. It introduces common types of density curves, such as the uniform, triangular, and normal distributions, and provides practice questions to reinforce the learning.
Takeaways
- 📊 A histogram can be transformed into a relative frequency distribution by dividing the frequency of each interval by the total number of individuals.
- 🔢 The total area under any frequency distribution is always equal to one or 100%, representing the whole dataset.
- 📈 A density curve is a smooth curve that visualizes the overall shape of a distribution, offering an idealized picture of a population without considering outliers.
- 🌐 Density curves are advantageous over histograms as they are not limited by the number of intervals and are easier to work with for large populations.
- 📚 The usefulness of density curves increases with larger populations, as they can be more accurately represented with many small intervals.
- 🎯 Density curves can be used to make approximations about the distribution of data, such as the proportion of people scoring within certain ranges on a test.
- 📋 For a density curve to be valid, it must lie on or above the horizontal axis and the total area under the curve must equal one.
- 📐 There are different types of density curves, each with its own properties and names, such as the uniform, triangular, and normal distributions.
- 🔍 The normal distribution, also known as the bell curve, is particularly important in statistics and will be discussed further in upcoming videos.
- 🤔 Practice questions in the video illustrate how to interpret density curves, such as estimating the percentage of people within certain weight ranges.
- 📝 Understanding the properties and calculations related to density curves is essential for analyzing and approximating data distributions effectively.
Q & A
What is the difference between a frequency distribution and a relative frequency distribution?
-A frequency distribution tells us the number of people within a given interval, whereas a relative frequency distribution tells us the proportion or percentage of data values within the same interval.
How do you convert a frequency distribution into a relative frequency distribution?
-To convert a frequency distribution into a relative frequency distribution, you divide the number of people in each interval by the total number of individuals in the dataset.
Why is the total area of any frequency distribution equal to one or 100%?
-The total area of any frequency distribution is equal to one or 100% because it represents the entire dataset, ensuring all parts of the distribution are accounted for.
What is a density curve and what does it represent?
-A density curve is a graphical representation that helps visualize the overall shape of a distribution. It is derived from a histogram by drawing a smooth curve around its distribution.
What are the advantages of using density curves over histograms?
-Density curves provide an idealized picture of a population without considering irregularities and outliers, are not limited by the number of intervals, and are generally easier to work with, especially for large populations.
Why are density curves particularly useful for large populations?
-Density curves are useful for large populations because they can be accurately represented by continuously reducing the length of intervals until an infinite number of intervals is achieved, providing a smooth and continuous representation of the data.
How can density curves be used to make approximations?
-Density curves can be used to make approximations by estimating the proportion of data within certain intervals. For example, you can estimate the percentage of people scoring within a certain range on a test by looking at the area under the curve within that range.
What are the two main rules for having a valid density curve?
-The two main rules for a valid density curve are: 1) The curve must lie on or above the horizontal axis, and 2) The total area under the curve must be equal to one.
What is the significance of the normal distribution, also known as the bell curve, in statistics?
-The normal distribution, or bell curve, is significant in statistics because it is a common density curve that represents many natural phenomena and is widely used in various statistical analyses.
How can you estimate the percentage of people who weigh between 150 and 152 pounds using a density curve?
-You can estimate the percentage by calculating the area under the density curve between 150 and 152 pounds. This can be done by approximating the area of the shape formed by the curve and the horizontal lines at these weights, and then converting this area into a percentage.
What is the width of a uniform distribution's density curve if the length is 8 and it must be a valid density curve?
-The width of the uniform distribution's density curve is 0.125, calculated by dividing the total area (which is 1 for a valid density curve) by the length of the curve (8).
What proportion of values are located between 12.3 and 18.6 on a uniform distribution's density curve?
-The proportion of values located between 12.3 and 18.6 on a uniform distribution's density curve is 31.5%, calculated by finding the area of the rectangle formed by these two values and the curve, and then converting this area into a proportion.
Outlines
📊 Introduction to Density Curves and Histograms
This paragraph introduces the concept of density curves and their properties, starting with a review of histograms and frequency distributions. It explains the difference between a regular frequency distribution and a relative frequency distribution using an example of 20 people's weights. The paragraph further clarifies the process of converting a frequency distribution into a relative frequency distribution and emphasizes that the total area of any frequency distribution equals one or 100%. It introduces density curves as a visual tool to represent the overall shape of a distribution, explaining their advantages over histograms, such as providing an idealized picture of a dataset without irregularities, not being limited by the number of intervals, and being easier to work with for large populations. The paragraph also discusses the practicality of density curves with large populations and their use for making approximations, setting the stage for further exploration of density curve properties in upcoming videos.
📚 Understanding Density Curve Properties and Types
The second paragraph delves into the properties that make a density curve valid, such as lying on or above the horizontal axis and having a total area under the curve equal to one. It then introduces different types of density curves, including the uniform distribution, triangular distribution, and the normal distribution, also known as the bell curve. The paragraph uses practice questions to illustrate how to interpret density curves, emphasizing the importance of understanding that the area under the curve represents proportions, not exact counts. It corrects a common mistake made by students when interpreting density curves and provides a method to estimate the area under a curve for a given interval. The paragraph concludes with an example calculation for a uniform distribution to determine the width required for the curve to be valid, reinforcing the principles discussed.
Mindmap
Keywords
💡Density Curve
💡Histogram
💡Relative Frequency Distribution
💡Frequency Distribution
💡Interval
💡Normal Distribution
💡Uniform Distribution
💡Triangular Distribution
💡Area Under the Curve
💡Valid Density Curve
💡Approximation
Highlights
Introduction to density curves and their properties as a review before delving into the main topic.
Explanation of transforming a regular frequency distribution into a relative frequency distribution.
The importance of knowing the total number of individuals for converting frequency to relative frequency.
The rule that the total area of any frequency distribution must equal one or 100%.
Definition and creation of a density curve from a histogram.
Advantages of density curves over histograms, including an idealized picture of a population and handling of large populations.
The practicality of density curves with very large populations and their infinite interval capability.
Use of density curves for making approximations, such as estimating test scores of a large group.
Properties of a valid density curve, including lying on or above the horizontal axis and having a total area equal to one.
Different types of density curves, such as the uniform, triangular, and normal distributions.
The significance of the normal distribution, also known as the bell curve, in statistics.
Practice questions to apply understanding of density curves and their properties.
Clarification on the incorrect assumption that a vertical line on a density curve represents a percentage of individuals.
Method to estimate the area under a density curve for a given interval using rectangles and squares.
Explanation of how to calculate the proportion of values within a specific interval on a uniform distribution.
The process of determining the width of a uniform distribution to ensure it is a valid density curve.
Encouragement to support the channel for more educational content and access to study guides and practice questions.
Transcripts
Browse More Related Video
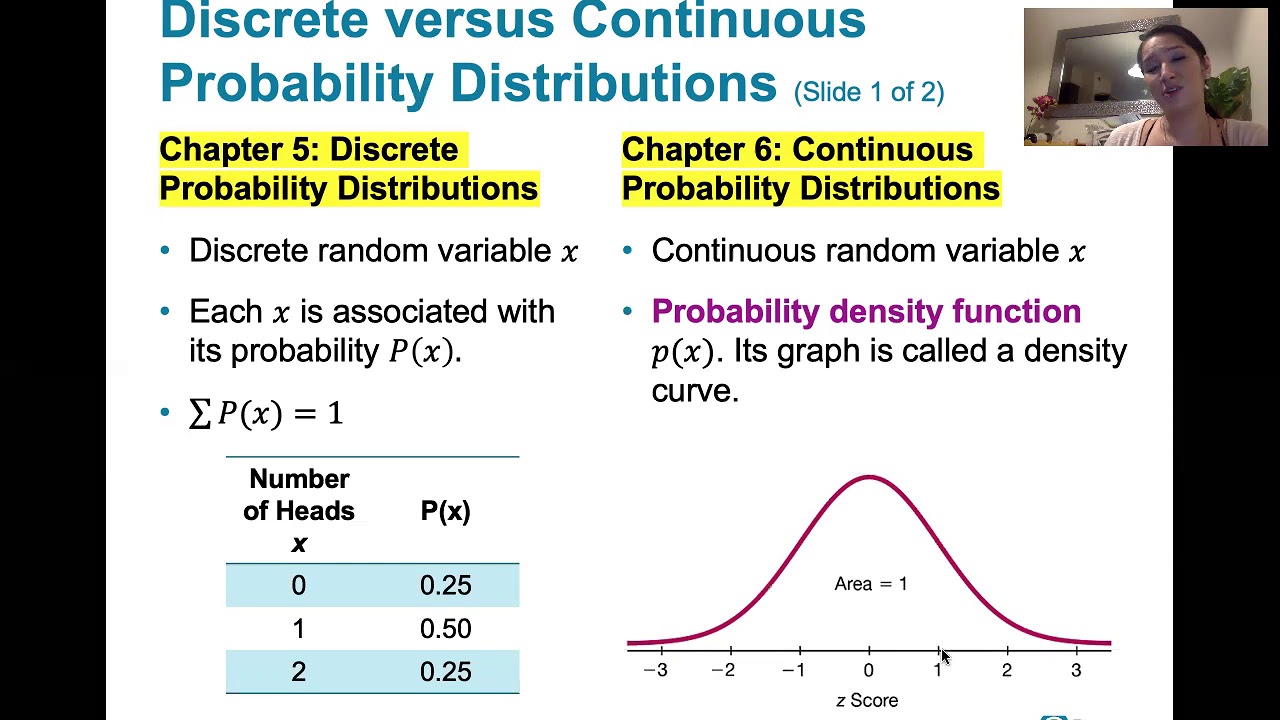
6.1.1 The Standard Normal Distribution - Discrete and Continuous Probability Distributions
Density Curves | Modeling data distributions | AP Statistics | Khan Academy
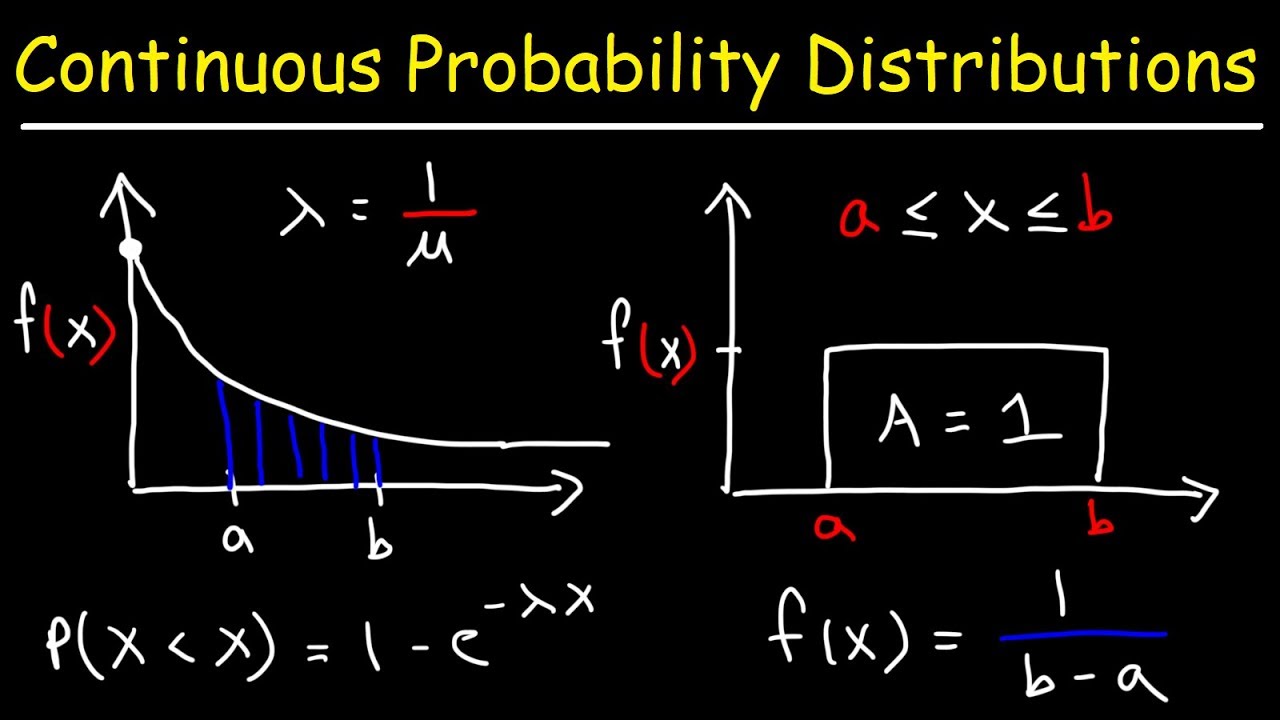
Continuous Probability Distributions - Basic Introduction
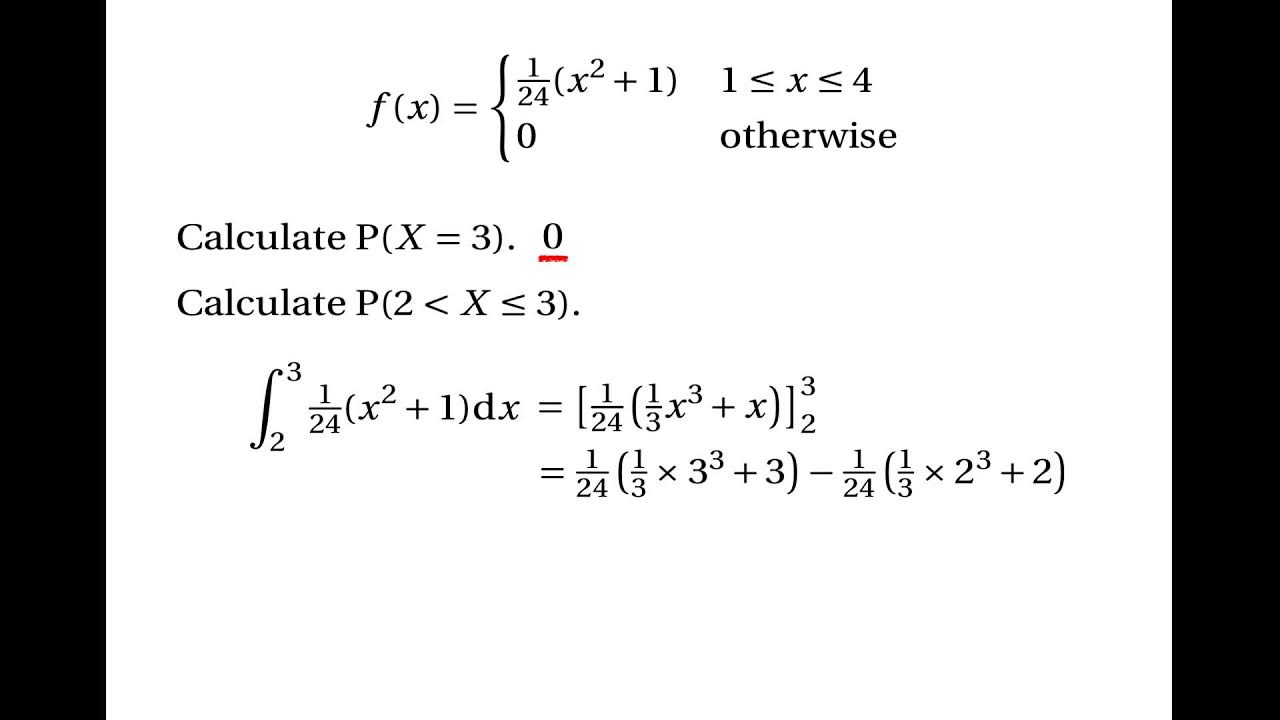
Continuous Random Variables: Probability Density Functions
The Main Ideas behind Probability Distributions

Session 40 - Probability Distribution Functions - PDF, PMF & CDF | DSMP 2023
5.0 / 5 (0 votes)
Thanks for rating: