The Main Ideas behind Probability Distributions
TLDRIn this StatQuest episode, the concept of statistical distributions is introduced through the analogy of measuring people's heights at a party. The script explains how data is organized into bins to form a histogram, which visually represents the distribution of heights. It highlights the advantages of using a smooth curve to approximate the histogram, such as calculating probabilities for non-bin values and overcoming bin width limitations. The episode concludes by emphasizing that both histograms and curves are forms of distributions, illustrating the likelihood of various measurements, and hints at exploring different types of distributions in future videos.
Takeaways
- 🎉 StatQuest is a statistical education channel supported by the genetics department at the University of North Carolina at Chapel Hill.
- 📊 A statistical distribution represents how often different outcomes occur, using concepts like histograms to visualize the distribution of data.
- 🔍 The script uses the example of measuring people's heights to explain the concept of a distribution, with measurements sorted into 'bins'.
- 📈 A histogram is a graphical representation of the distribution of data, showing the frequency of data points within specified ranges or 'bins'.
- 🌟 Most people's heights fall within a certain range, typically between 5 and 6 feet, indicating a common distribution pattern with a peak around the average.
- 🔎 Using smaller bins can provide a more precise representation of the data distribution, allowing for more detailed insights.
- 📊 A curve can be used to approximate the histogram, offering a smooth representation of the data distribution.
- 🧩 The curve has the advantage of allowing for the calculation of probabilities for data points that did not fall into a specific bin.
- 📐 The curve is not restricted by bin width, enabling the calculation of probabilities for any range of data points, even those not initially measured.
- ⏱ Using a curve can save time and money, as it allows for estimation based on the mean and standard deviation without needing extensive data collection.
- 📚 Both histograms and curves are types of distributions, showing where data points are most and least likely to occur.
- 🔮 The script hints at the existence of various types of distributions with different shapes, which will be explored in future episodes of StatQuest.
Q & A
What is the main topic discussed in the StatQuest video?
-The main topic discussed in the StatQuest video is the concept of a statistical distribution.
What is a bin in the context of the video?
-A bin, in this context, is a range of values into which measurements are grouped, such as the height of people in increments from 5 feet to 5.5 feet.
How does a histogram represent the distribution of measurements?
-A histogram represents the distribution of measurements by stacking the measurements into bins and showing the frequency of each bin, which gives a visual sense of the data's spread and concentration.
What is the significance of the tallest part of a histogram or curve in a distribution?
-The tallest part of a histogram or curve in a distribution signifies the region where measurements are most likely to occur, indicating the mode or peak of the distribution.
Why are people shorter than 5 feet or taller than 6 feet considered rare in the video's example?
-In the video's example, people shorter than 5 feet or taller than 6 feet are considered rare because the histogram shows that most measurements fall between these heights, making extreme values less likely.
What advantage does using a curve to approximate a histogram have over the histogram itself?
-A curve allows for the calculation of probabilities for values that did not fall into a specific bin, and it is not limited by the width of the bins, providing a more precise estimate of probabilities.
How can smaller bin sizes improve the accuracy of a distribution estimate?
-Smaller bin sizes allow for a more detailed representation of the data, making it possible to identify patterns and concentrations with greater precision.
What is calculus used for in the context of the video?
-In the context of the video, calculus can be used to calculate the probability of measurements falling within very specific ranges, without the need to round to the nearest bin size.
Why might a curve based on the mean and standard deviation be a practical alternative when time or money is limited?
-A curve based on the mean and standard deviation can provide a good approximation of the distribution without the need for a large number of measurements, thus saving time and resources.
What does the video suggest about the variety of distributions?
-The video suggests that there are all kinds of distributions with various interesting shapes, indicating that the concept of distribution is broad and can be applied to many different types of data.
What does the video imply about the importance of understanding statistical distributions?
-The video implies that understanding statistical distributions is crucial for interpreting data accurately, making informed decisions, and analyzing the likelihood of different outcomes.
Outlines
📊 Understanding Statistical Distributions
This paragraph introduces the concept of a statistical distribution through the analogy of a dance party where height measurements are categorized into bins, forming a histogram. It explains how the histogram reflects the likelihood of measuring various heights, with most people falling between 5 and 6 feet tall. The paragraph also discusses the benefits of using smaller bins for more precision and how a curve can be used to approximate the histogram, offering advantages such as the ability to calculate probabilities for any given height and not being limited by bin width. It concludes by emphasizing that both histograms and curves are types of distributions that represent the spread of probabilities for measurements.
👋 Farewell and Anticipation for Future Episodes
The final paragraph serves as a closing remark, signaling the end of the current StatQuest episode and creating anticipation for the next installment. It invites viewers to tune in for more exciting content in the future, suggesting that upcoming episodes will delve into various types of distributions and their unique characteristics.
Mindmap
Keywords
💡Distribution
💡Histogram
💡Bin
💡Probability
💡Curve
💡Mean
💡Standard Deviation
💡Calculus
💡Precision
💡Measurement
💡Genetics Department
Highlights
StatQuest is a statistical education series brought to you by the genetics department at the University of North Carolina at Chapel Hill.
The episode focuses on explaining what a statistical distribution is.
A distribution can be illustrated by measuring the height of a group of people and categorizing the measurements into bins.
A histogram is created by stacking these measurements into bins, showing the frequency of each height range.
Most people's height measurements fall between 5 and 6 feet, indicating a common range.
Smaller bins provide a more precise estimate of the distribution of heights.
A curve can be used to approximate the histogram, offering a smooth representation of the distribution.
The curve allows for the calculation of probabilities for measurements that did not fall into a specific bin.
The curve is not restricted by bin width, enabling more detailed probability calculations.
Using a curve can save time and money when extensive data collection is not feasible.
Both histograms and curves are types of distributions that show how probabilities of measurements are spread out.
The tallest part of a histogram or curve indicates the most likely region for measurements.
The lower parts of a histogram or curve show where measurements are less probable.
The episode introduces the concept that there are various types of distributions with different shapes.
Future episodes of StatQuest will explore different types of distributions and their unique characteristics.
The episode concludes by encouraging viewers to tune in for the next StatQuest episode.
Transcripts
Browse More Related Video
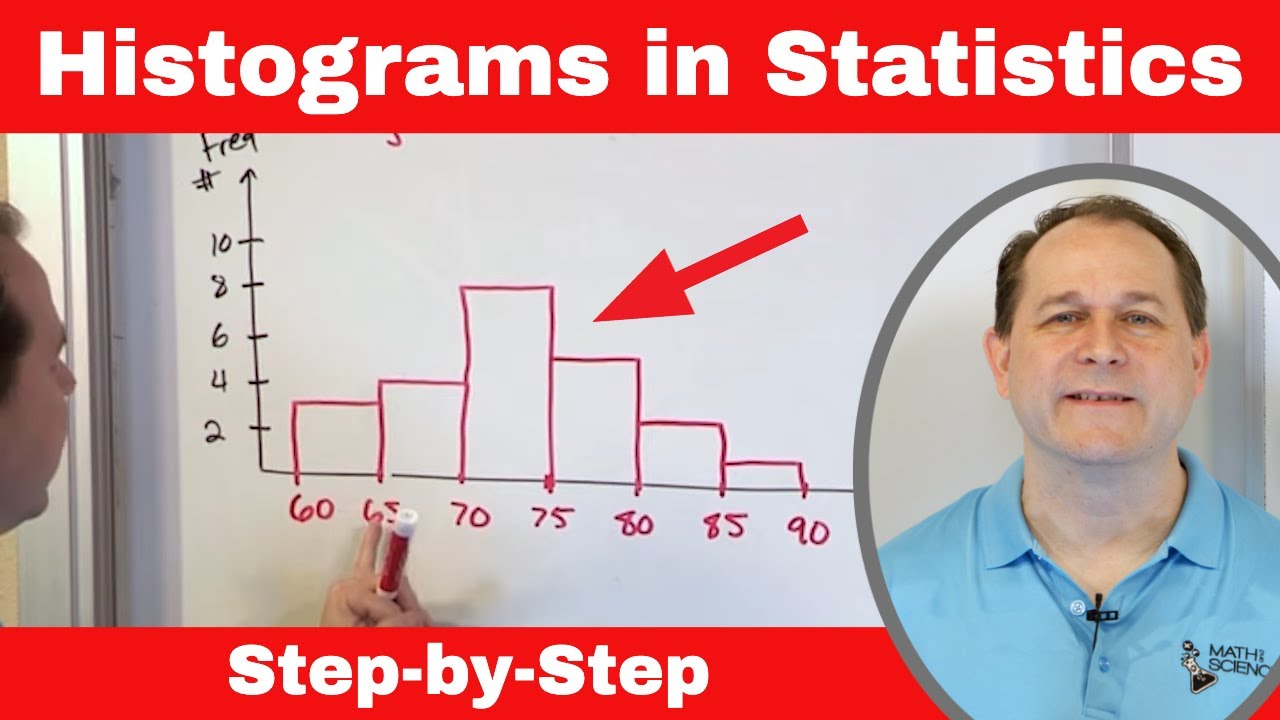
Mastering Statistics: Understand & Draw Histograms of Data
Sampling from a Distribution, Clearly Explained!!!
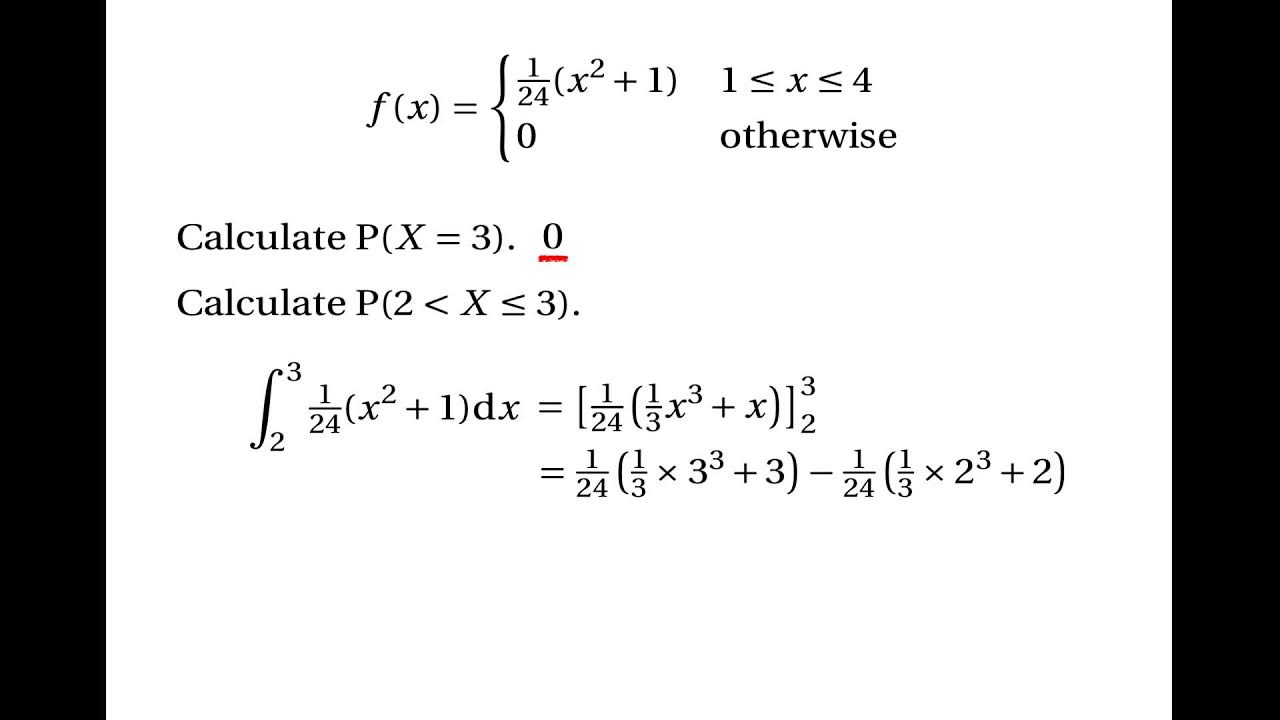
Continuous Random Variables: Probability Density Functions
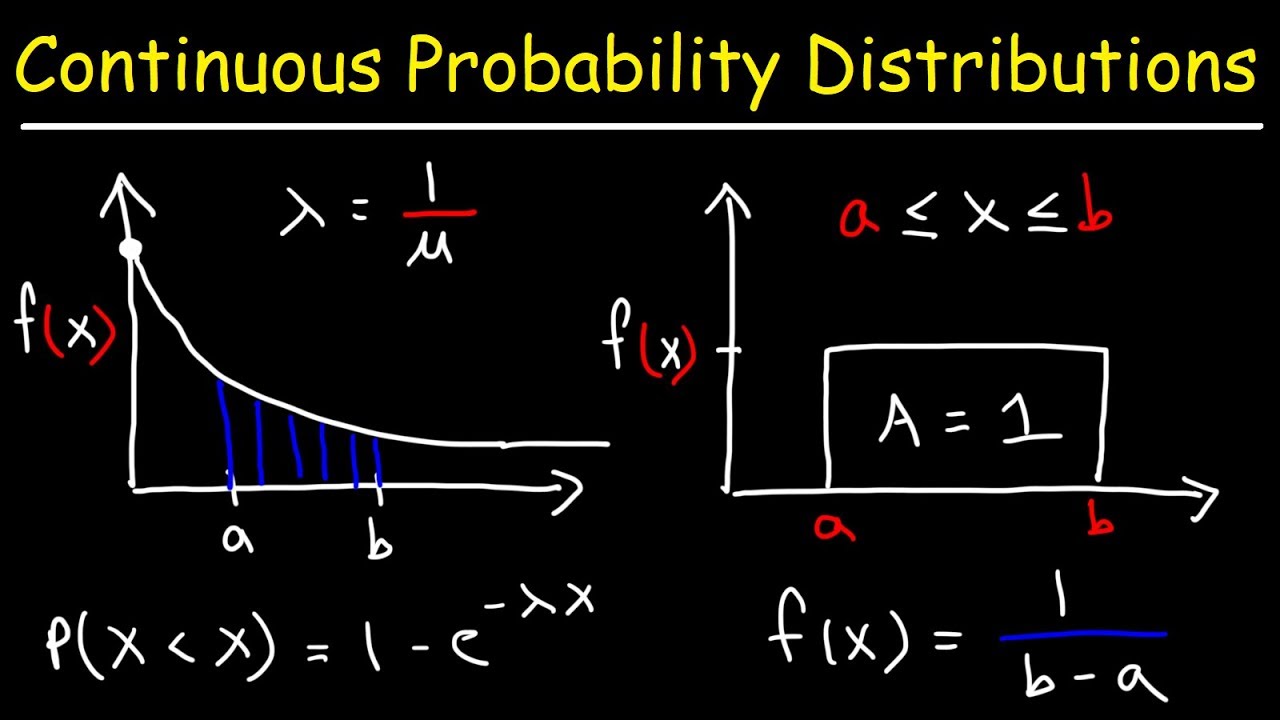
Continuous Probability Distributions - Basic Introduction
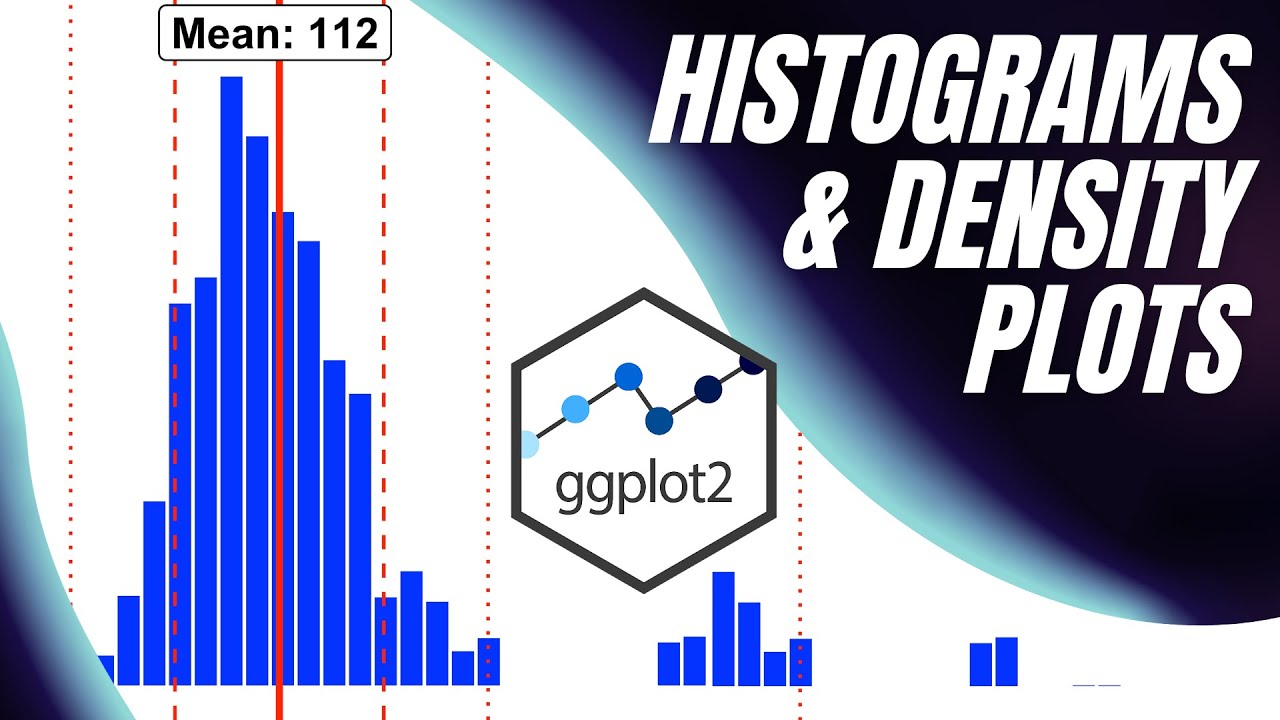
Histograms and Density Plots with {ggplot2}
Density Curves | Modeling data distributions | AP Statistics | Khan Academy
5.0 / 5 (0 votes)
Thanks for rating: