Session 40 - Probability Distribution Functions - PDF, PMF & CDF | DSMP 2023
TLDRThe lecture begins with a discussion on probability distributions, emphasizing its importance for data analysts and scientists. It introduces the concept of random variables and distinguishes between discrete and continuous random variables using practical examples like coin tosses and dice rolls. The lecture then explains probability distribution functions (PDFs) and their significance, highlighting common types like normal and uniform distributions. It covers mathematical functions to model relationships between outcomes and probabilities, including the role of parameters. The lecture concludes with an introduction to non-parametric density estimation, specifically Kernel Density Estimation (KDE), and its application in various scenarios.
Takeaways
- 📚 The lecture introduces the concept of Probability Distribution, a fundamental topic in statistics for data analysts and scientists.
- 🎓 It explains the difference between discrete and continuous random variables, which is crucial for understanding the types of probability distributions.
- 📈 The importance of probability distribution is emphasized for modeling real-world data and making inferences.
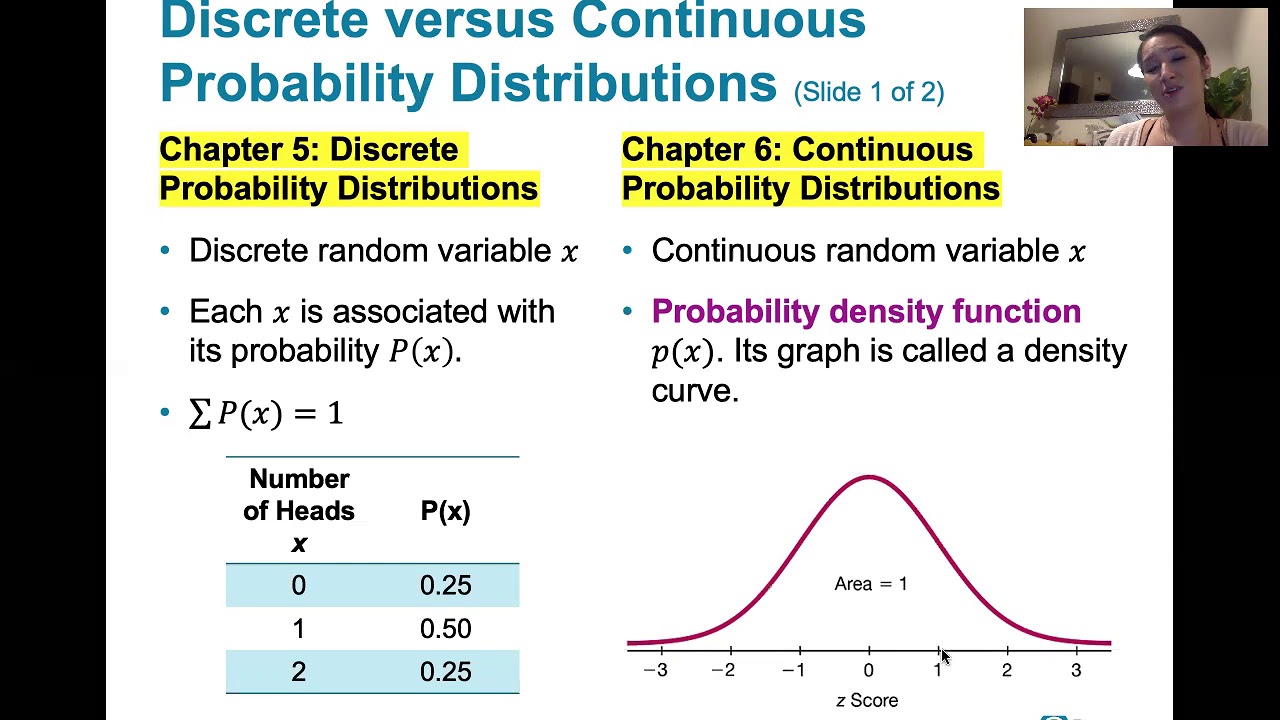
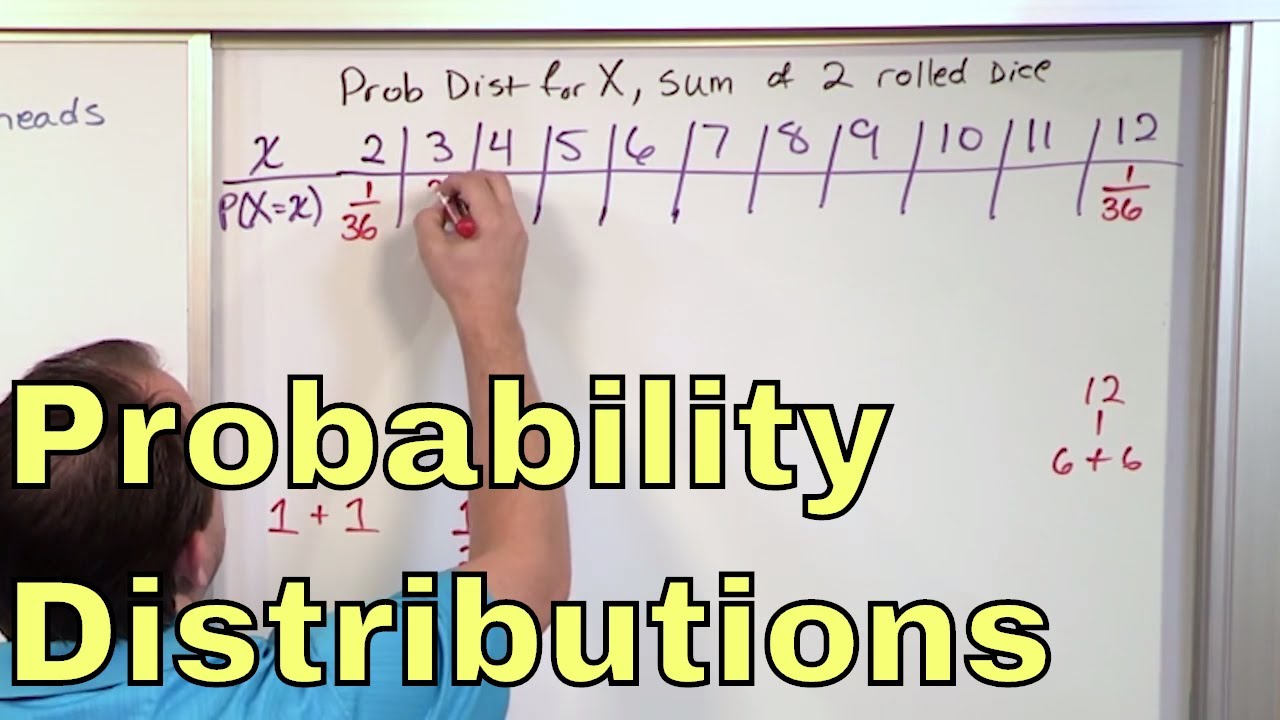
- 📊 The lecture discusses the creation of a probability distribution table for discrete random variables, like the outcomes of a die roll.
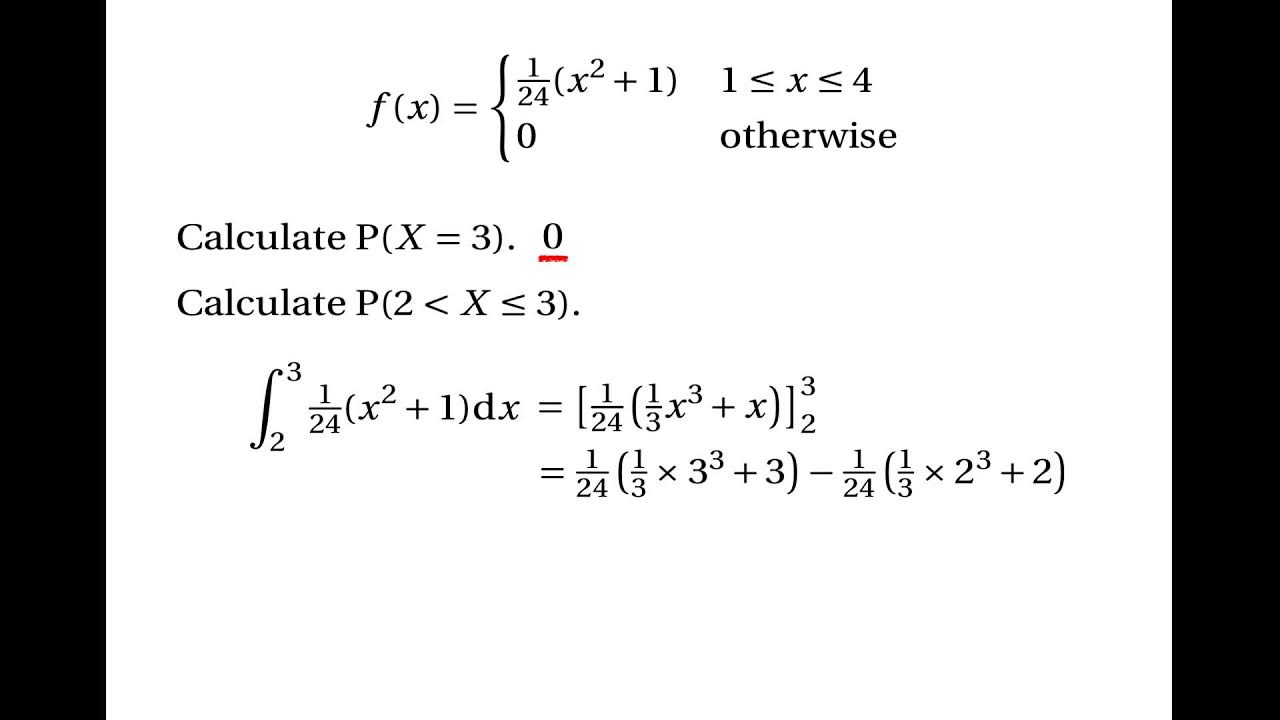
- 📉 For continuous random variables, the concept of a probability density function is introduced, which is different from a probability mass function used for discrete variables.
- 🔢 The process of calculating probabilities for different events is covered, including the use of mathematical equations to find exact probabilities.
- 📝 The transcript mentions the use of Python's pandas library for conducting experiments, such as rolling a die, and analyzing the outcomes.
- 📉 The lecture differentiates between the probability mass function (PMF) and the cumulative distribution function (CDF) for discrete random variables.
- 📊 For continuous variables, the concept of a probability density function (PDF) is explained, which helps in understanding the likelihood of data points within a range.
- 🔧 The practical application of these concepts is demonstrated through the use of histograms to estimate probability densities and the creation of PDF plots.
- 🔍 The lecture concludes with a discussion on the importance of selecting the right type of probability distribution to model data accurately.
Q & A
What is the main topic of the lecture?
-The main topic of the lecture is Probability Distribution, focusing on understanding and implementing various concepts related to it.
What are the two types of random variables discussed in the script?
-The two types of random variables discussed are Discrete Random Variables and Continuous Random Variables.
What is a Random Experiment in the context of the lecture?
-A Random Experiment is an activity with a set of possible outcomes where the result is not certain and can be predicted only in terms of probabilities.
What is the purpose of a Probability Distribution Table?
-A Probability Distribution Table is used to list all possible outcomes of a random experiment along with their corresponding probabilities.
What is a Parameter in the context of Probability Distributions?
-In the context of Probability Distributions, a Parameter is a numerical value that helps define the distribution's shape, location, and scale.
Why is it important to understand the shape of the data distribution?
-Understanding the shape of the data distribution is important because it provides insights into the data's characteristics, such as which values are more frequent and which are less, allowing for better analysis and inference.
What is a Cumulative Distribution Function (CDF) and how is it related to Probability Density Function (PDF)?
-A Cumulative Distribution Function (CDF) is the integral of the Probability Density Function (PDF) and represents the probability that a random variable will take a value less than or equal to a specific value.
What is the difference between Probability Mass Function (PMF) and Probability Density Function (PDF)?
-Probability Mass Function (PMF) is used for discrete random variables and gives the probability of exactly taking a particular value, whereas Probability Density Function (PDF) is used for continuous random variables and gives the likelihood of the variable falling within a particular range of values.
What is the significance of the Normal Distribution in statistics?
-The Normal Distribution is significant in statistics because it is a widely observed distribution in natural phenomena and is used as a basis for many statistical procedures and inference tests.
How can the shape of a Probability Distribution be inferred from the data?
-The shape of a Probability Distribution can be inferred from the data by plotting the data and observing its distribution pattern, such as whether it is symmetric, skewed, or follows a specific known distribution like Normal or Uniform.
What is Kernel Density Estimation (KDE) and how is it used in non-parametric density estimation?
-Kernel Density Estimation (KDE) is a non-parametric way to estimate the probability density function of a random variable. It is used by placing a smooth, symmetric kernel function at each data point and averaging the results to create a smooth estimate of the density function.
Outlines
📚 Introduction to Probability Distributions
The speaker begins by introducing the topic of probability distributions, emphasizing its importance for data analysts and data scientists. They mention that today's lecture will be slightly difficult due to the complexity of the concepts but assures that understanding these concepts will be very beneficial. The speaker provides a brief overview of the lecture's content, which includes basic statistics measures such as mean, median, mode, and standard deviation, and promises to delve into more complex concepts that might be new to the audience.
🔢 Understanding Random Variables
The speaker explains the concept of random variables, distinguishing them from the variables taught in algebra. They define a random variable as a set of possible values resulting from a random experiment, using the example of a coin toss to illustrate the concept. The speaker also introduces the notation used for random variables, capital letters for random variables versus small letters for algebraic variables, and discusses the difference between discrete and continuous random variables, providing examples for each.
📈 Probability Distribution Function (PDF)
The speaker discusses the probability distribution function, which describes the probability of different values that a random variable can take. They explain that a PDF is a mathematical function that relates to the possible outcomes of a random variable and their corresponding probabilities. The speaker also introduces the concept of the distribution table and the challenges of creating such a table for continuous random variables, suggesting that a mathematical function can be a more practical solution.
📉 Cumulative Distribution Function (CDF)
The speaker introduces the cumulative distribution function, which represents the probability that a random variable will take a value less than or equal to a specific value. They explain the concept by referring to the sum of probabilities up to a certain point and how it can be used to understand the distribution of data. The speaker also touches on the practical applications of CDF in various domains such as technology, healthcare, and engineering.
📚 Types of Probability Distributions
The speaker outlines the different types of probability distributions, focusing on the importance of understanding these distributions for statistical analysis and inference. They mention that there are two main types of distributions: discrete and continuous, each with its own unique properties and applications. The speaker also emphasizes the importance of parameters in probability distributions, which can affect the shape, location, and scale of the distribution.
📘 The Concept of Probability Density
The speaker delves into the concept of probability density, which is a function that describes the likelihood of a random variable taking a specific value in a continuous distribution. They explain that probability density is not a probability itself but a rate that, when integrated over an interval, gives the probability of the random variable falling within that interval. The speaker also discusses the importance of understanding probability density for statistical analysis.
📊 Density Estimation Techniques
The speaker discusses density estimation techniques, which are used to estimate the probability density function of a continuous random variable based on a set of observations. They differentiate between parametric and non-parametric methods, explaining that parametric methods require assumptions about the form of the distribution, while non-parametric methods make no such assumptions. The speaker also introduces kernel density estimation as a popular non-parametric technique.
📈 Demonstrating Density Estimation with Data
The speaker provides a practical demonstration of density estimation using a dataset. They generate data from a normal distribution and use kernel density estimation to create a smooth curve that represents the estimated probability density function. The speaker emphasizes the importance of choosing the right bandwidth for the kernel function to ensure an accurate estimation.
📉 Non-Parametric Density Estimation
The speaker explores non-parametric density estimation in more detail, explaining that it does not require assumptions about the underlying distribution and can be used for any type of data. They discuss the advantages of non-parametric methods, such as their flexibility and the ability to handle complex data distributions, as well as the challenges, including computational intensity and the potential for inaccurate estimates with small datasets.
📊 Practical Application of PDF and CDF
The speaker discusses the practical applications of probability density functions and cumulative distribution functions in data analysis. They explain how these functions can be used to understand the distribution of data and make inferences about the population from which the sample was drawn. The speaker also touches on the importance of using these functions in various fields such as finance, engineering, and science.
📈 Normal Distribution and Its Parameters
The speaker focuses on the normal distribution, one of the most common probability distributions, and its parameters, specifically the mean (μ) and standard deviation (σ). They explain how these parameters define the shape and spread of the distribution and how they can be estimated from a dataset. The speaker also discusses the importance of the normal distribution in various fields and its role in statistical analysis.
📉 Histograms and Density Plots
The speaker discusses the use of histograms and density plots to visualize data distribution. They explain that while histograms provide a frequency distribution, density plots can give a smoother representation of the data's distribution, which can be particularly useful for understanding the underlying pattern in the data.
📚 Conclusion and Future Topics
The speaker concludes the lecture by summarizing the key points covered in the session, including the importance of probability distributions, the concept of random variables, and the use of PDFs and CDFs. They also mention that in future lectures, they will discuss specific distributions in more detail and demonstrate how to apply these concepts to real-world data analysis.
Mindmap
Keywords
💡Probability Distribution
💡Random Variable
💡Discrete Random Variable
💡Continuous Random Variable
💡Probability Density Function (PDF)
💡Cumulative Distribution Function (CDF)
💡Normal Distribution
💡Parameters
💡Histogram
💡Kernel Density Estimation (KDE)
💡Data Analysis
Highlights
Introduction to the concept of probability distribution, a fundamental topic in statistics.
Explanation of the importance of understanding probability distribution for data analysis.
Discussion on the difference between discrete and continuous random variables.
Elucidation on the definition of a random variable and its distinction from algebraic variables.
Introduction to the sample space and its significance in probability.
Explanation of discrete random variables using examples like coin tosses and dice rolls.
Introduction to continuous random variables and their range of possible values.
The concept of probability distribution function (PDF) and its role in modeling the relationship between outcomes and probabilities.
Differentiation between probability mass function (PMF) for discrete variables and probability density function for continuous variables.
Demonstration of how to calculate probabilities for specific outcomes using PMF and PDF.
The role of parameters in probability distributions and how they affect the shape of distribution curves.
Overview of various types of probability distributions, including normal, uniform, and binomial distributions.
Practical implementation of probability distributions in data analysis and statistical inference.
Importance of matching the data's distribution to a known probability distribution for accurate analysis.
Discussion on the limitations of using histograms to represent data distribution and when to use PDFs instead.
Explanation of cumulative distribution function (CDF) and its relationship with PMF and PDF.
The application of probability distributions in various fields such as technology, medicine, and engineering.
The significance of probability distributions in statistical hypothesis testing and decision making.
Overview of non-parametric density estimation techniques for modeling unknown distributions.
Practical demonstration of creating and interpreting probability density plots for continuous data.
Transcripts
Browse More Related Video
Introduction to Random Variables

Mathematical Statistics, Lecture 1
6.1.1 The Standard Normal Distribution - Discrete and Continuous Probability Distributions
Continuous Random Variables: Probability Density Functions

Elementary Stats Lesson #11
02 - Random Variables and Discrete Probability Distributions
5.0 / 5 (0 votes)
Thanks for rating: