Power
TLDRThis educational script delves into the concept of statistical power, using the example of a medication designed to enhance typing speed. It explains the null hypothesis, set at an average typing speed of 30 words per minute, and the alternative hypothesis, which assumes the medication increases this average to 46 words per minute. The script outlines the process of calculating standard error and using it to plot distributions under both hypotheses. It then demonstrates how to determine the power of a test, which is the probability of correctly rejecting the null hypothesis when it is false, and beta, the probability of a type II error. By calculating z-scores and referring to a Z-table, the script concludes with an example showing a high power (98%) of correctly rejecting the null hypothesis, and a low type II error rate (2%).
Takeaways
- 😌 The concept of 'power' in statistics is challenging for some to grasp, and it's being explained through an example involving a new medication that claims to improve typing ability.
- 🔍 The average typing speed is 30 words per minute (WPM) with a standard deviation of 16. The medication is expected to increase this average to 46 WPM.
- 📊 A sample of 16 individuals is used to test the medication's effectiveness, and the goal is to determine the probability of correctly concluding its effectiveness through a statistical test.
- 🎯 The null hypothesis (H0) is that the mean typing speed is 30 WPM, while the alternative hypothesis (H1) is that it's different from 30 WPM.
- 🧐 Power is defined as the probability of correctly rejecting the null hypothesis when the alternative hypothesis is true, and beta (β) is the probability of incorrectly retaining the null hypothesis.
- 📐 The standard error is calculated as the standard deviation divided by the square root of the sample size, which in this case is 4.
- 📉 The distribution under the null hypothesis is centered at 30 with a standard error of 4, and an alpha level of 0.05 is used to determine critical values.
- 📈 The distribution under the alternative hypothesis is centered at 46 with the same standard error of 4, representing the expected mean if the medication works.
- 📚 The power of the test is represented by the area under the alternative hypothesis distribution that falls outside the critical values determined by the alpha level.
- 🔢 The critical value at 1.96 standard errors from the mean under the null hypothesis corresponds to a z-score calculation under the alternative hypothesis.
- 📘 Using a z-table, the area to the body (right tail) corresponding to a z-score of 2.04 (negative of 1.96 in the alternative distribution) is found to be 0.9793, which represents the power of the test.
- 🚫 The type II error rate, or beta, is calculated as 1 - power, which in this case is 1 - 0.9793 = 0.0207, or 2%.
Q & A
What is the concept of 'power' in the context of statistical hypothesis testing?
-In statistical hypothesis testing, 'power' refers to the probability of correctly rejecting the null hypothesis when the alternative hypothesis is true. It is a measure of the test's ability to detect an effect if there is one.
What is the null hypothesis in the context of the medication test for typing ability?
-The null hypothesis in this scenario is that the average typing speed is 30 words per minute, which is the baseline average before the medication is administered.
What is the alternative hypothesis in the medication test for typing ability?
-The alternative hypothesis is that the medication has an effect and the average typing speed is different from 30 words per minute, with the assumption that it increases to 46 words per minute.
What is the significance level (alpha) used in the medication test, and what does it represent?
-The significance level (alpha) used in the medication test is 0.05. It represents the probability of rejecting the null hypothesis when it is actually true, also known as the Type I error rate.
How is the standard error calculated in this scenario?
-The standard error is calculated by dividing the standard deviation of the population by the square root of the sample size. In this case, the standard deviation is 16, and the sample size is 16, resulting in a standard error of 4.
What is the role of the standard error in the hypothesis testing process?
-The standard error provides a measure of how much the sample mean is expected to vary from sample to sample. It is used to construct confidence intervals and to determine how far an observed mean must be from the hypothesized mean to be statistically significant.
What does the term 'Type II error' or 'beta' represent in hypothesis testing?
-A 'Type II error' or 'beta' is the probability of incorrectly retaining the null hypothesis when it is actually false. It represents the test's failure to detect an effect when there is one.
How is the power of a test related to the Type II error?
-The power of a test is equal to 1 minus the probability of a Type II error (beta). A higher power means a lower probability of making a Type II error, indicating a more sensitive test.
What is the difference between the distributions drawn when the null hypothesis is true and when it is false?
-The distribution when the null hypothesis is true has a mean of 30 words per minute, while the distribution when the null hypothesis is false (assuming the alternative is true) has a mean of 46 words per minute. Both distributions have a standard error of 4.
How is the z-score used in calculating the power and Type II error in this scenario?
-The z-score is calculated by taking the difference between the critical value (37.84 in this case) and the mean under the alternative hypothesis (46), divided by the standard error (4). This z-score is then used to look up the area in the tail of the distribution, which represents the power, and the remaining area represents the Type II error.
What is the calculated power of the test in the medication study, and what does it signify?
-The calculated power of the test is approximately 98%. This means there is a 98% chance that the test will correctly reject the null hypothesis if the medication indeed increases the average typing speed to 46 words per minute.
What is the Type II error rate in the medication study, and what does it imply?
-The Type II error rate, or beta, is 2%. This implies there is a 2% chance that the test will incorrectly fail to reject the null hypothesis when it is actually false, meaning the test might miss the effect of the medication.
Outlines
🔬 Understanding Statistical Power in Medication Testing
This paragraph introduces the concept of statistical power in the context of a hypothetical medication test aimed at improving typing ability. The average typing speed is stated as 30 words per minute with a standard deviation of 16. The medication is expected to increase this average to 46 words per minute. A sample size of 16 individuals is used to test the medication's efficacy. The concept of power is explained as the probability of correctly rejecting the null hypothesis (which states the mean is 30) when the alternative hypothesis (that the mean is different from 30) is true. The paragraph also explains type 2 error, which is the probability of incorrectly retaining the null hypothesis when it is false. An alpha level of 0.05 is used for the test, and the standard error is calculated to be 4. The paragraph concludes with a visual representation of the distributions under the null and alternative hypotheses and explains how power is the area under the alternative hypothesis distribution that exceeds the critical value determined by the alpha level.
📊 Calculating Power and Type 2 Error in Hypothetical Medication Test
This paragraph delves into the calculation of statistical power and type 2 error for the medication test scenario described earlier. It begins by calculating the z-score for the test, using the critical value of 1.96 from the standard normal distribution when the null hypothesis is true. The z-score is calculated by taking the difference between the expected mean under the alternative hypothesis (46 words per minute) and the critical value (37.84 words per minute), divided by the standard error (4). This results in a z-score of -2.04. The paragraph then describes how to use a z-table to find the area in the tail corresponding to this z-score, which represents the power of the test (the probability of correctly rejecting the null hypothesis). The power is found to be approximately 98%, meaning there is a high likelihood that the test will correctly identify the medication as effective. The type 2 error, or beta, is the complement of power, indicating the probability of failing to reject the null hypothesis when it is false, which in this case is about 2%.
Mindmap
Keywords
💡Power
💡Null Hypothesis
💡Alternative Hypothesis
💡Type I Error
💡Type II Error
💡Standard Deviation
💡Sample Size
💡Standard Error
💡Alpha Level
💡Z-Score
💡Hypothesis Testing
Highlights
Explains the concept of power in statistical testing using an example of a medication that claims to improve typing ability
The average person types at 30 words per minute with a standard deviation of 16
The medication is expected to increase average words per minute typed to 46
A sample of 16 individuals is taken to determine if the medication improves typing ability
Assumes the medication works and the null hypothesis is false while the alternative hypothesis is true
Power is the probability of correctly rejecting the null hypothesis when it is false
Beta is the probability of incorrectly retaining the null hypothesis when it is false
Uses an alpha level of 0.05 for the statistical test
Calculates the standard error as the standard deviation divided by the square root of the sample size
Finds a standard error of 4 for the given example
Shows how to plot the distribution if the null hypothesis is true with a mean of 30 and standard error of 4
Uses an alpha level of 0.05 to determine the critical values of 1.96
Plots a second distribution if the null hypothesis is false with a mean of 46 and standard error of 4
The large orange area in the second distribution represents the power of the test
Calculates the value associated with 1.96 standard errors from the mean in the second distribution
Finds that 1.96 standard errors corresponds to a value of 37.84 in the second distribution
Calculates the z-score to determine the probabilities associated with power and the type 2 error
Looks up the z-score of -2.04 in a standard normal table to find the area in the tail
Finds that the power is about 98% and the type 2 error rate is 2%
Power represents the probability of correctly rejecting the null hypothesis when it is false
The type 2 error rate, or beta, is the probability of not rejecting the null hypothesis when it is false
Transcripts
Browse More Related Video
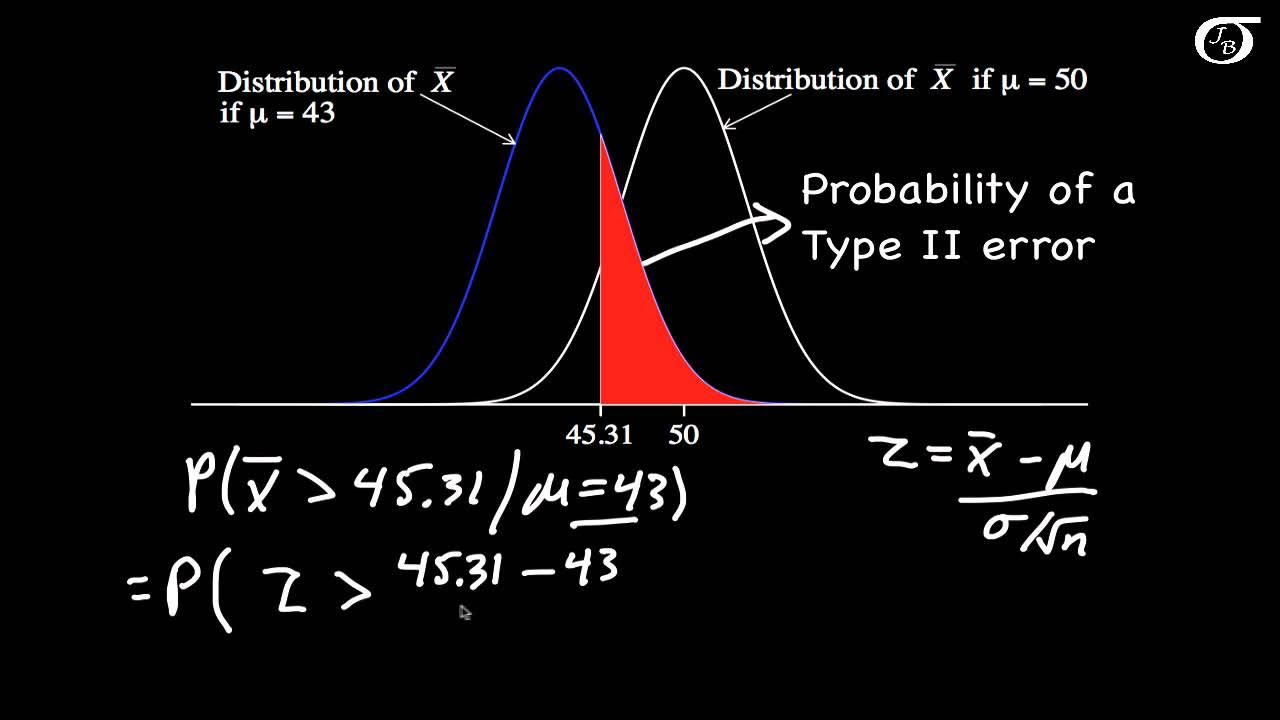
Calculating Power and the Probability of a Type II Error (A One-Tailed Example)
Introduction to Type I and Type II errors | AP Statistics | Khan Academy

Introduction to power in significance tests | AP Statistics | Khan Academy
8.1.2 Basics of Hypothesis Testing - Significance Level, Type I and Type II Error
Type 1 errors | Inferential statistics | Probability and Statistics | Khan Academy
Errors and Power in Hypothesis Testing | Statistics Tutorial #16 | MarinStatsLectures
5.0 / 5 (0 votes)
Thanks for rating: