Introduction to power in significance tests | AP Statistics | Khan Academy
TLDRThe video script delves into the concept of statistical power in significance testing, a topic often introduced in first-year statistics courses. Power is defined as the probability of correctly rejecting a false null hypothesis, which can also be viewed as one minus the probability of committing a Type II error. The script explains that power can be influenced by several factors, including the significance level (alpha), sample size (n), variability within the dataset, and the distance of the true parameter from the null hypothesis. Increasing the alpha level boosts power but also raises the risk of a Type I error. Conversely, a larger sample size or less variability in the data inherently increases power without such trade-offs. The video aims to provide a clear understanding of what power represents and how it can be improved, emphasizing the importance of sample size and the delicate balance between alpha level adjustments and the potential for Type I errors.
Takeaways
- 📊 **Power Definition**: Power is the probability of correctly rejecting the null hypothesis when it is false.
- 🔍 **Type II Error Connection**: Power can also be viewed as one minus the probability of making a Type II error, which is not rejecting the null hypothesis when it is false.
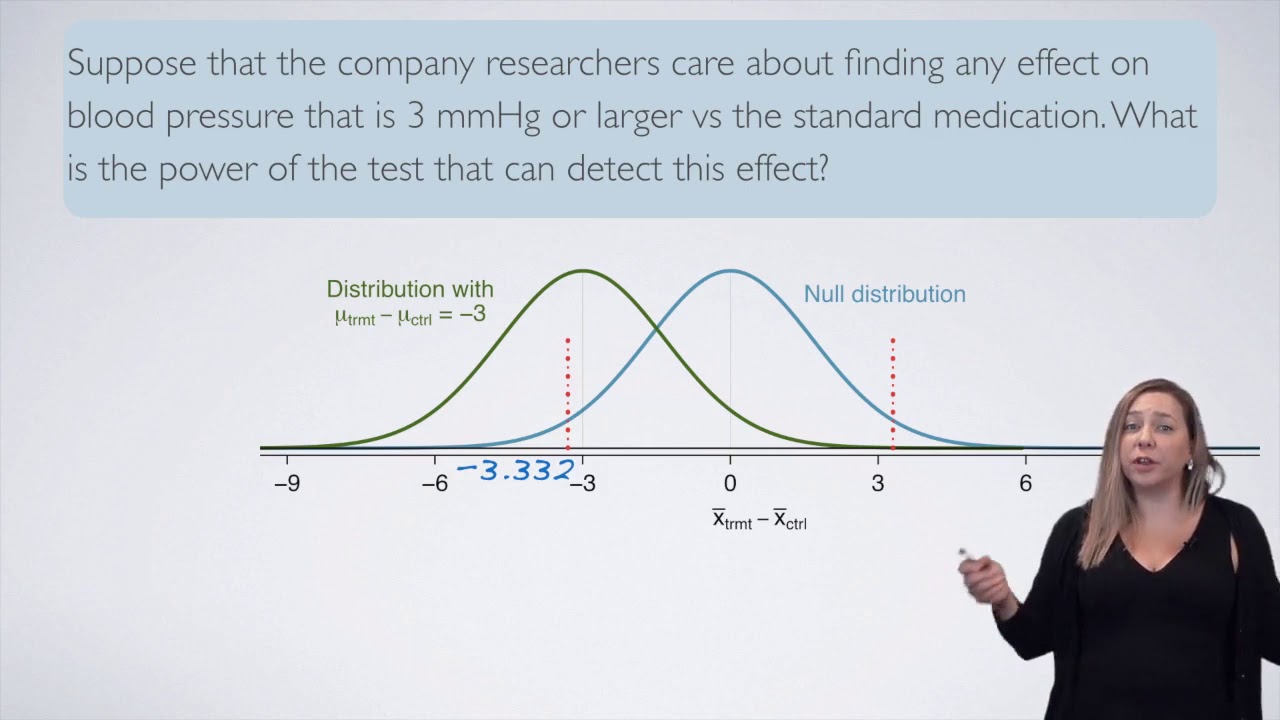
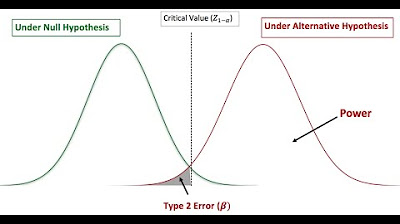
- 📈 **Sampling Distributions**: Two sampling distributions are considered: one under the assumption that the null hypothesis is true, and another when it is false.
- 🎯 **Significance Level**: The significance level (alpha) is the probability of rejecting the null hypothesis when it is true, and it is also related to the power of the test.
- 🔴 **Increasing Power**: Power can be increased by raising the significance level, which however increases the risk of a Type I error.
- 🔵 **Sample Size Impact**: Increasing the sample size (n) narrows the sampling distributions and reduces the overlap, thus increasing power.
- 📊 **Variability Reduction**: Less variability in the dataset, as measured by variance or standard deviation, leads to narrower sampling distributions and higher power.
- 🔗 **Effect Size**: The greater the difference between the true parameter value and the null hypothesis value, the higher the power of the test.
- ⚖️ **Trade-offs**: There's a trade-off between increasing power and the risk of Type I errors when adjusting the significance level.
- 🔧 **Control Factors**: Researchers can control the sample size and to some extent the significance level to influence power, but other factors like variability and effect size are often outside of their control.
- ✅ **Best Practice**: Generally, increasing the sample size is a good strategy to increase power without introducing more risk of Type I errors.
Q & A
What is the concept of power in the context of significance tests?
-Power is the probability that you correctly reject the null hypothesis when it is not true. It is the likelihood of avoiding a Type II error, which is not rejecting the null hypothesis when it should be rejected.
How is power related to Type II errors?
-Power is equal to one minus the probability of making a Type II error. It is the probability of correctly rejecting the null hypothesis when it is false.
What happens to the sampling distribution if the null hypothesis is true?
-If the null hypothesis is true, the sampling distribution's center would be at the hypothesized parameter value (mu one), and the distribution's width would be influenced by the sample size.
How does the sample size affect the sampling distribution?
-The sample size affects the width of the sampling distribution. A larger sample size results in a narrower distribution, while a smaller sample size results in a wider distribution.
What is the significance level in a significance test?
-The significance level is the probability of rejecting the null hypothesis when it is true, which is also the probability of making a Type I error.
How does increasing the alpha level affect the power of a test?
-Increasing the alpha level increases the power of a test because it expands the area under the sampling distribution that would lead to the rejection of the null hypothesis. However, it also increases the probability of a Type I error.
What is the impact of increasing the sample size on the power of a test?
-Increasing the sample size narrows both sampling distributions, reducing the overlap between them and thus reducing the probability of a Type II error, which increases the power of the test.
How does the variability in the dataset affect the power of a test?
-Less variability in the dataset results in narrower sampling distributions, which reduces the area representing the probability of a Type II error and increases the power of the test.
What is the effect of the true parameter being further from the null hypothesis on the power?
-If the true parameter is further away from what the null hypothesis states, it increases the power because it increases the separation between the sampling distributions under the null and alternative hypotheses.
Why might a researcher be hesitant to increase the significance level to boost power?
-A researcher might be hesitant because increasing the significance level also increases the probability of a Type I error, which is the incorrect rejection of a true null hypothesis.
What is the trade-off involved in deciding the significance level?
-The trade-off is between increasing power and the risk of a Type I error. A higher significance level increases power but also the chance of incorrectly rejecting a true null hypothesis.
Why is increasing the sample size generally considered a good strategy to increase power?
-Increasing the sample size is beneficial because it narrows the sampling distributions, reducing the chance of a Type II error without increasing the risk of a Type I error.
Outlines
📊 Understanding Statistical Power
This paragraph introduces the concept of power in the context of significance tests, which is a fundamental topic in introductory statistics. Power is defined as the probability of correctly rejecting a false null hypothesis. It's portrayed as a conditional probability and is also related to the concept of Type II errors. The instructor emphasizes the importance of understanding what factors can increase or decrease the power of a test, and prepares to illustrate this with sampling distributions under both the null hypothesis and an alternative scenario where the null hypothesis is false.
🎯 Factors Influencing Statistical Power
The second paragraph delves into the factors that can affect the power of a statistical test. It explains how increasing the significance level (alpha) can boost power but also raises the risk of a Type I error. The paragraph also highlights the impact of sample size on power, noting that a larger sample size narrows the sampling distribution and reduces the chance of a Type II error. Variability in the dataset, represented by variance or standard deviation, is another factor that can influence power, with less variability leading to more distinct sampling distributions. Lastly, the true parameter value's distance from the null hypothesis's claim is mentioned as a factor that can increase power, although this is often not under the researcher's control. The paragraph concludes by reiterating the importance of sample size and the trade-offs involved in adjusting the significance level.
Mindmap
Keywords
💡Power
💡Significance Test
💡Null Hypothesis
💡Alternative Hypothesis
💡Type II Error
💡Sample Size (n)
💡Significance Level (alpha)
💡Sampling Distribution
💡Type I Error
💡Variance
💡Population Mean (mu)
Highlights
Power in significance tests is the probability of doing the right thing when the null hypothesis is not true.
Power can also be viewed as one minus the probability of making a Type II error.
The significance level is the probability of rejecting the null hypothesis even if it is true, which is also the probability of a Type I error.
Increasing the sample size narrows the sampling distribution and increases the power of the test.
Less variability in the dataset, measured by variance or standard deviation, results in narrower sampling distributions and higher power.
If the true parameter is significantly different from the null hypothesis, it increases the power of the test.
Increasing the alpha level (significance level) increases power but also the probability of a Type I error.
The significance level and sample size are controllable factors that can be adjusted to affect power.
There is a trade-off when increasing the significance level to gain power, as it raises the risk of a Type I error.
Researchers may choose to increase the significance level if they consider a Type II error to be worse.
The sampling distribution under the null hypothesis is centered at the hypothesized parameter value.
The conditional probability of power is calculated given that the null hypothesis is false.
The probability of not rejecting the null hypothesis when it is false defines a Type II error.
The area under the sampling distribution curve beyond the significance level represents the power of the test.
The concept of power is introduced in first-year statistics courses and is important for understanding significance testing.
The width of the sampling distribution is affected by the sample size; larger sample sizes result in narrower distributions.
The probability of making a Type II error is the area under the sampling distribution where the null hypothesis is not rejected when it is false.
Researchers must balance the desire to increase power with the risk of committing a Type I error by adjusting the significance level.
Transcripts
Browse More Related Video
5.0 / 5 (0 votes)
Thanks for rating: