Introduction to Type I and Type II errors | AP Statistics | Khan Academy
TLDRThe video script discusses the concepts of Type I and Type II errors within the framework of significance testing. It begins by reviewing the process of formulating a null hypothesis, which represents the status quo, and an alternative hypothesis, which proposes a different scenario. The script explains that a significance test involves taking a sample from a population, calculating a statistic to estimate a parameter, and then determining the probability (p-value) of obtaining that statistic if the null hypothesis were true. If the p-value is below a predetermined significance level (commonly 5%), the null hypothesis is rejected. The script then introduces the potential for errors: a Type I error occurs when the null hypothesis is true but is incorrectly rejected, while a Type II error happens when the null hypothesis is false but is not rejected. The significance level directly relates to the probability of committing a Type I error. The video concludes by setting the stage for future examples that will help identify these errors.
Takeaways
- 🔍 **Significance Testing Overview**: The process involves formulating a null hypothesis (status quo) and an alternative hypothesis (suggesting something different), then using a sample to test the null hypothesis.
- 📊 **Statistic Calculation**: A statistic is calculated from a sample to estimate the parameter in question, which is then used to infer about the population.
- 🎯 **p-value and Significance Level**: The p-value, representing the probability of obtaining the sample statistic under the null hypothesis, is compared to a pre-set significance level (α) to decide whether to reject the null hypothesis.
- ❌ **Type I Error**: Occurs when the null hypothesis is true, but it is incorrectly rejected. The probability of a Type I error is equal to the significance level.
- ✅ **Correct Retention**: If the null hypothesis is true and not rejected, it is considered a correct conclusion.
- 🚫 **Type II Error**: Happens when the null hypothesis is false, but it is not rejected. This is a failure to detect the actual effect or difference.
- 📉 **Power of a Test**: The probability of correctly rejecting a false null hypothesis is known as the power of the test, which is impacted by the risk of committing a Type II error.
- 🔄 **Decision Matrix**: The outcomes of hypothesis testing can be visualized in a 2x2 grid representing the reality (null hypothesis true or false) and the decision made (reject or fail to reject the null hypothesis).
- 🧮 **Hypothesis Testing Steps**: The process includes setting up hypotheses, taking a sample, calculating a statistic, determining the p-value, comparing it to the significance level, and making a decision.
- 📈 **Sample Size Impact**: The size of the sample can influence the statistic and the resulting p-value, which in turn affects the decision to reject or not reject the null hypothesis.
- 🔗 **Hypothesis and Conclusion Link**: Rejecting the null hypothesis may suggest support for the alternative hypothesis, especially when the p-value is low.
- 📚 **Further Examples**: Upcoming videos will provide examples to identify errors, specifically Type I and Type II errors, in the context of hypothesis testing.
Q & A
What are Type I and Type II errors in the context of significance testing?
-Type I error occurs when the null hypothesis is true, but it is incorrectly rejected. Type II error happens when the null hypothesis is false, but it is not rejected.
What is a null hypothesis?
-A null hypothesis is a statement that is assumed to be true at the start of a significance test, typically representing the status quo or no effect.
What is an alternative hypothesis?
-An alternative hypothesis is a statement that proposes an alternative to the null hypothesis, suggesting that there is an effect or a difference worth investigating.
How is a significance test conducted?
-A significance test is conducted by first formulating a null and an alternative hypothesis, then taking a sample from the population, calculating a statistic to estimate the parameter in question, and determining the probability (p-value) of obtaining that statistic if the null hypothesis were true. The test result is compared against a predetermined significance level to decide whether to reject or fail to reject the null hypothesis.
What is a p-value in significance testing?
-A p-value is the probability of obtaining a test statistic as extreme as, or more extreme than, the one calculated from the sample, assuming the null hypothesis is true. If the p-value is less than the significance level, the null hypothesis is rejected.
What is the significance level (alpha) in a significance test?
-The significance level, often denoted as alpha, is a threshold probability that determines whether the null hypothesis is rejected or not. If the p-value is less than the significance level, the null hypothesis is rejected.
What is the probability of making a Type I error?
-The probability of making a Type I error is equal to the significance level (alpha) set before conducting the test. It represents the likelihood of rejecting a true null hypothesis.
What is the correct conclusion when the null hypothesis is true and it is not rejected?
-When the null hypothesis is true and it is not rejected, it is considered a correct conclusion, indicating that the test result aligns with the actual state of the null hypothesis.
What is the correct conclusion when the null hypothesis is false and it is rejected?
-When the null hypothesis is false and it is rejected, it is also considered a correct conclusion, as the test has correctly identified the null hypothesis as not being true.
What is the probability of making a Type II error?
-The probability of making a Type II error is not directly determined by the significance level. It depends on the sample size, the actual effect size, and the statistical power of the test, which is the probability of correctly rejecting a false null hypothesis.
How can one reduce the risk of making a Type II error?
-To reduce the risk of making a Type II error, one can increase the sample size, use a more powerful statistical test, or adjust the significance level to be more stringent, although this could potentially increase the risk of a Type I error.
What is the relationship between the significance level and the statistical power of a test?
-The significance level and the statistical power are inversely related. A lower significance level reduces the risk of a Type I error but increases the risk of a Type II error, meaning the test becomes less powerful. Conversely, a higher significance level increases the power of the test but raises the risk of a Type I error.
Outlines
🔍 Introduction to Type I and Type II Errors
The video begins with an introduction to Type I and Type II errors in the context of significance testing. It explains the process of formulating a null and alternative hypothesis about a population's true parameter. The null hypothesis is typically the status quo, while the alternative suggests a different scenario. The significance test involves taking a sample from the population, calculating a statistic to estimate the parameter, and then determining the probability (p-value) of obtaining that statistic if the null hypothesis were true. If the p-value is less than a predetermined significance level (alpha), the null hypothesis is rejected. The video also discusses the potential for errors in this process: a Type I error occurs when the null hypothesis is true but is rejected, and a Type II error occurs when the null hypothesis is false but not rejected. The significance level represents the probability of a Type I error, while the video sets the stage for future examples to explore Type II errors.
Mindmap
Keywords
💡Significance Testing
💡Null Hypothesis
💡Alternative Hypothesis
💡Sample
💡Statistic
💡P-value
💡Significance Level (Alpha)
💡Type I Error
💡Type II Error
💡Correct Conclusion
💡Error
Highlights
The video discusses Type I and Type II errors in the context of significance testing.
Significance testing involves formulating a null and an alternative hypothesis about a population's true parameter.
The null hypothesis typically represents the status quo, while the alternative suggests a deviation from it.
The process of testing involves deciding whether to reject or fail to reject the null hypothesis based on sample data.
A statistic is calculated from the sample to estimate the parameter in question.
The probability of obtaining the calculated statistic under the null hypothesis is known as the p-value.
If the p-value is below the significance level, the null hypothesis is rejected.
The significance level, often set at 5%, determines the threshold for rejecting the null hypothesis.
Rejecting the null hypothesis when it is true is a Type I error, with a probability equal to the significance level.
Failing to reject the null hypothesis when it is true is a correct conclusion.
Rejecting the null hypothesis when it is false leads to a correct conclusion.
Failing to reject the null hypothesis when it is false is a Type II error.
The video will include examples to identify Type I and Type II errors in future segments.
Understanding the probability of Type I errors is crucial for interpreting significance test results.
The significance level sets the standard for determining statistical significance in hypothesis testing.
Type I errors are false positives, while Type II errors are false negatives in hypothesis testing.
The grid model helps visualize the four possible outcomes of hypothesis testing.
Correct conclusions are made when the null hypothesis is correctly rejected or not rejected based on its truth.
Errors occur when the decision to reject or not reject the null hypothesis contradicts its actual truth.
Transcripts
Browse More Related Video
Type I error vs Type II error
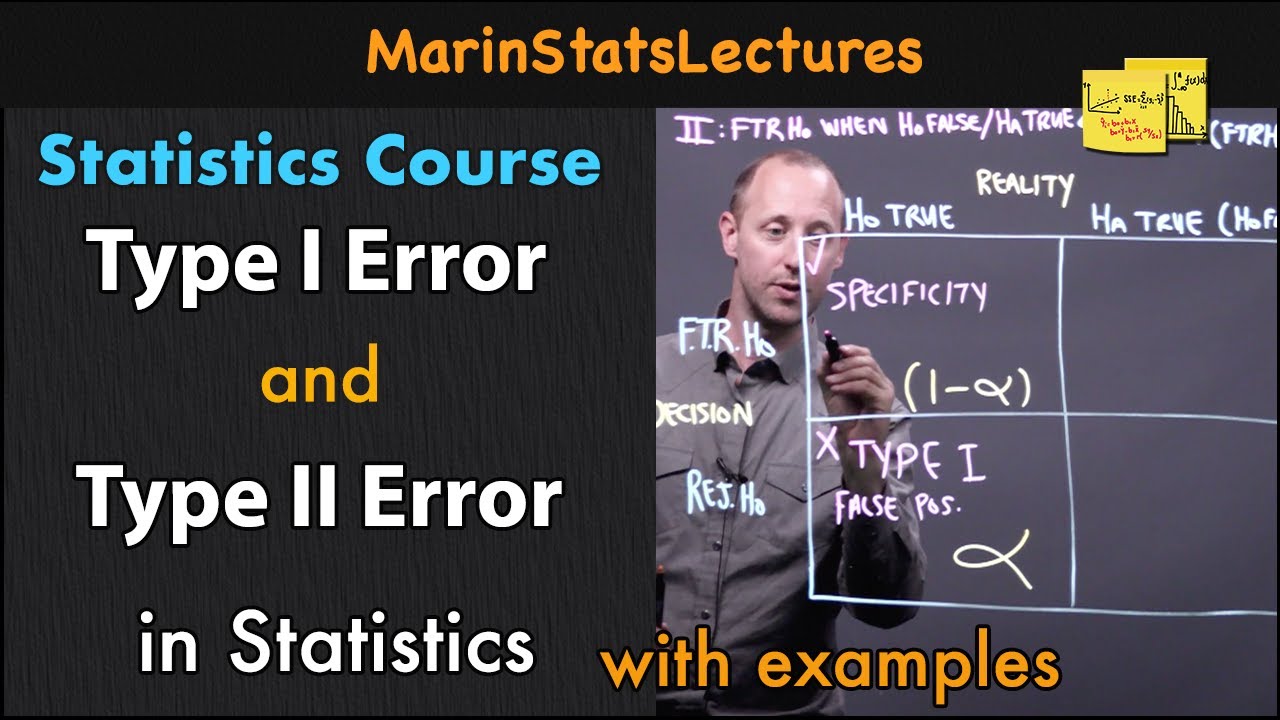
Errors and Power in Hypothesis Testing | Statistics Tutorial #16 | MarinStatsLectures
Type 1 errors | Inferential statistics | Probability and Statistics | Khan Academy

How To Identify Type I and Type II Errors In Statistics

P-values and significance tests | AP Statistics | Khan Academy
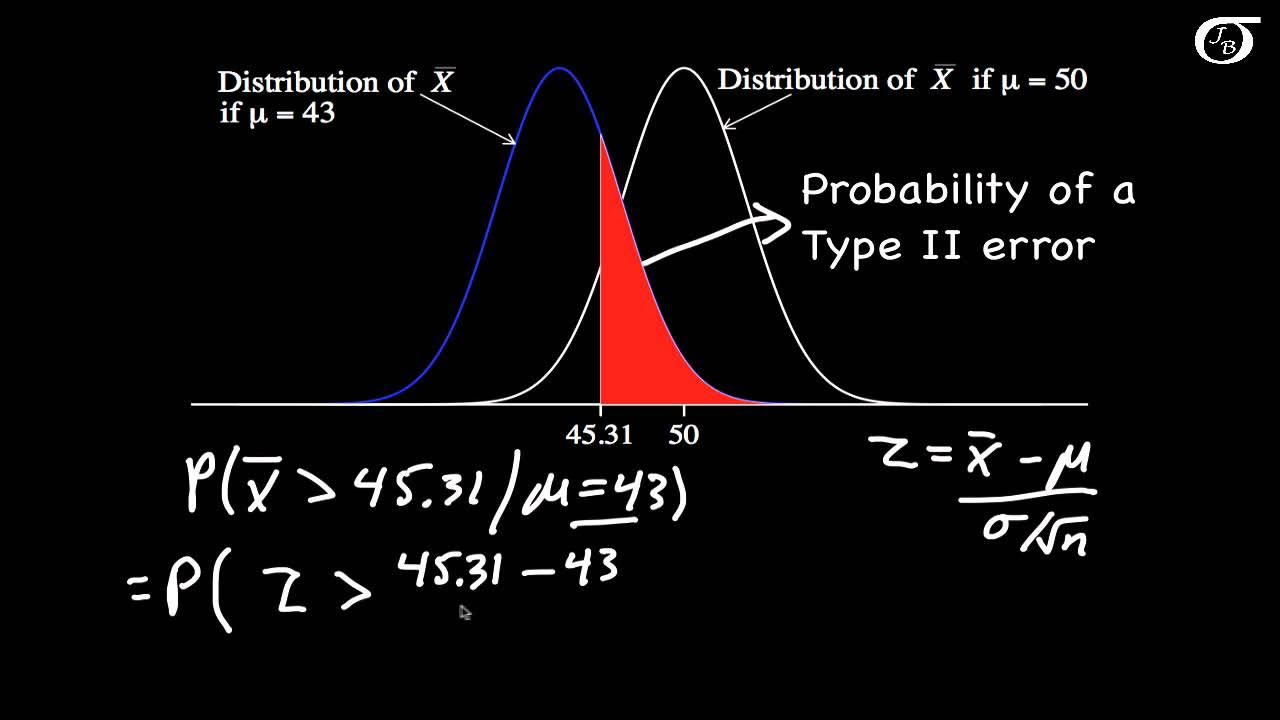
Calculating Power and the Probability of a Type II Error (A One-Tailed Example)
5.0 / 5 (0 votes)
Thanks for rating: