Type 1 errors | Inferential statistics | Probability and Statistics | Khan Academy
TLDRThe video script introduces the concept of a Type 1 Error in the context of statistical hypothesis testing. It explains that a Type 1 Error occurs when the null hypothesis is incorrectly rejected even though it is true. The script uses the example of a sample mean to illustrate how a threshold, such as 1%, is set to determine the likelihood of observing a statistic as extreme as the one obtained from the sample data. If the probability of such an extreme statistic is less than the threshold, the null hypothesis is rejected, which could lead to a Type 1 Error if the null hypothesis was indeed true. The video aims to clarify this potentially confusing topic by providing a clear explanation and an example to help viewers understand the implications of rejecting the null hypothesis when it is actually true.
Takeaways
- 📊 Type 1 Error is the mistake of rejecting the null hypothesis when it is actually true.
- ✅ The null hypothesis is always assumed to be true at the start of hypothesis testing.
- 🔍 A distribution with a specific mean value is created under the assumption that the null hypothesis is true.
- 📉 The probability of obtaining a certain statistic or more extreme result is calculated if the null hypothesis holds.
- 🔮 If the probability of getting a statistic as extreme as observed is very low (e.g., 1%), the null hypothesis may be rejected.
- 🚫 Rejecting the null hypothesis when it is true means a Type 1 Error has been made.
- 🧮 The significance level (e.g., 1%) sets the threshold for deciding whether to reject the null hypothesis.
- 📉 Given a significance level, if the observed sample mean is extremely unlikely under the null hypothesis, it is rejected.
- 🤔 The area under the curve representing the probability of a result as extreme or more so is what determines the likelihood of a Type 1 Error.
- 📝 There is a small chance (e.g., 0.5%) that a Type 1 Error is made when the null hypothesis is incorrectly rejected.
- 💡 Understanding Type 1 Error is crucial for interpreting the results of statistical hypothesis tests correctly.
Q & A
What is a Type 1 Error in the context of a statistics class?
-A Type 1 Error is the mistake made when the null hypothesis is rejected even though it is actually true.
What is the null hypothesis in statistical testing?
-The null hypothesis is a statement that there is no effect or no difference, which is assumed to be true at the start of a statistical test.
How is the mean value determined when the null hypothesis is assumed to be true?
-The mean value is determined based on the assumption that the null hypothesis is true, which typically sets the mean to a specific value.
What is the role of a statistic in hypothesis testing?
-A statistic is used to evaluate the probability of obtaining a result as extreme as the one observed, assuming the null hypothesis is true.
What is the significance of setting a threshold in hypothesis testing?
-The threshold is the probability level at which the null hypothesis is rejected. If the probability of observing the statistic or a more extreme one is less than this threshold, the null hypothesis is rejected.
What does it mean to say there is a 1% chance of getting a result that extreme or greater if the null hypothesis is true?
-It means that if the null hypothesis were true, there would only be a 1% probability of observing a statistic as extreme as the one calculated from the data, or more extreme.
How does rejecting the null hypothesis when the statistic is extremely unlikely lead to a Type 1 Error?
-Rejecting the null hypothesis when the statistic is extremely unlikely is based on the assumption that the null hypothesis is true. However, if the null hypothesis is actually true and we reject it, we have made a Type 1 Error.
What is the probability of making a Type 1 Error if the threshold for rejection is 1% and the observed statistic leads to a 0.5% probability?
-The probability of making a Type 1 Error in this scenario is 0.5%. This is because there is a 0.5% chance that the extreme statistic could occur even if the null hypothesis is true.
Why is the concept of a Type 1 Error considered confusing by some students?
-The concept can be confusing because it involves understanding the idea of rejecting a true null hypothesis, which goes against the initial assumption that the null hypothesis is true.
What is the practical implication of making a Type 1 Error in real-world applications of statistics?
-Making a Type 1 Error could lead to incorrect conclusions and actions based on the data, potentially causing harm or wasting resources if the null hypothesis represents a true state of affairs.
How can understanding the concept of Type 1 Error improve one's ability to interpret statistical results?
-Understanding Type 1 Error helps to recognize the limitations of statistical tests, the importance of setting appropriate thresholds, and the potential for false positives, which can lead to more accurate and informed decision-making.
What is the relationship between the threshold for rejecting the null hypothesis and the probability of making a Type 1 Error?
-The threshold for rejecting the null hypothesis directly influences the probability of making a Type 1 Error. A lower threshold increases the likelihood of rejecting the null hypothesis and thus increases the risk of a Type 1 Error.
Outlines
📊 Understanding Type 1 Error in Statistics
The video begins by introducing the concept of a Type 1 Error, which occurs when the null hypothesis is incorrectly rejected even though it is true. The presenter explains that in hypothesis testing, we always start by assuming the null hypothesis is true and then create a distribution based on this assumption. The focus is on determining the probability of observing a statistic as extreme as the one calculated if the null hypothesis were true. If this probability is low (e.g., 1%), the null hypothesis is rejected. The video uses the example of a sample mean that is significantly different from the assumed mean under the null hypothesis to illustrate this point. It concludes by emphasizing that rejecting the null hypothesis when it is true means there's a small chance (e.g., 0.5%) of having made a Type 1 Error, which is the mistake of incorrectly rejecting a true null hypothesis.
Mindmap
Keywords
💡Type 1 Error
💡Null Hypothesis
💡Hypothesis Testing
💡Statistic
💡Sample Mean
💡Probability
💡Threshold
💡Extreme Value
💡Distribution
💡Alternative Hypothesis
💡Error of Rejecting
Highlights
The concept of Type 1 Error in statistics is introduced.
Type 1 Error is defined as the error of rejecting the null hypothesis when it is actually true.
The importance of assuming the null hypothesis is true at the start of hypothesis testing is emphasized.
The mean under the null hypothesis usually equals some specified value, creating a distribution for analysis.
The probability of observing a statistic or more extreme result under the null hypothesis is calculated.
A threshold, such as 1%, is set to determine if the null hypothesis should be rejected based on the observed statistic.
If the observed statistic is extremely unlikely under the null hypothesis, the null hypothesis is rejected.
The concept of sample means and their role in determining the likelihood of a Type 1 Error is discussed.
The probability of a Type 1 Error is illustrated with an example of a sample mean resulting in a 0.5% chance of error.
The video aims to clarify the sometimes confusing nature of Type 1 Error.
Previous knowledge from earlier videos will be applied to understand the concept of Type 1 Error.
The video provides a practical example to solidify the understanding of Type 1 Error.
The significance of the threshold in hypothesis testing and its relation to Type 1 Error is explained.
The video emphasizes the risk of making a mistake when rejecting the null hypothesis due to a Type 1 Error.
Understanding the distribution under the null hypothesis is crucial for making statistical inferences.
The video outlines the steps taken when a statistic is observed that may lead to the rejection of the null hypothesis.
The role of probability in determining whether to reject the null hypothesis and the potential for a Type 1 Error is highlighted.
The video concludes by reinforcing the importance of understanding Type 1 Error in the context of statistical analysis.
Transcripts
Browse More Related Video
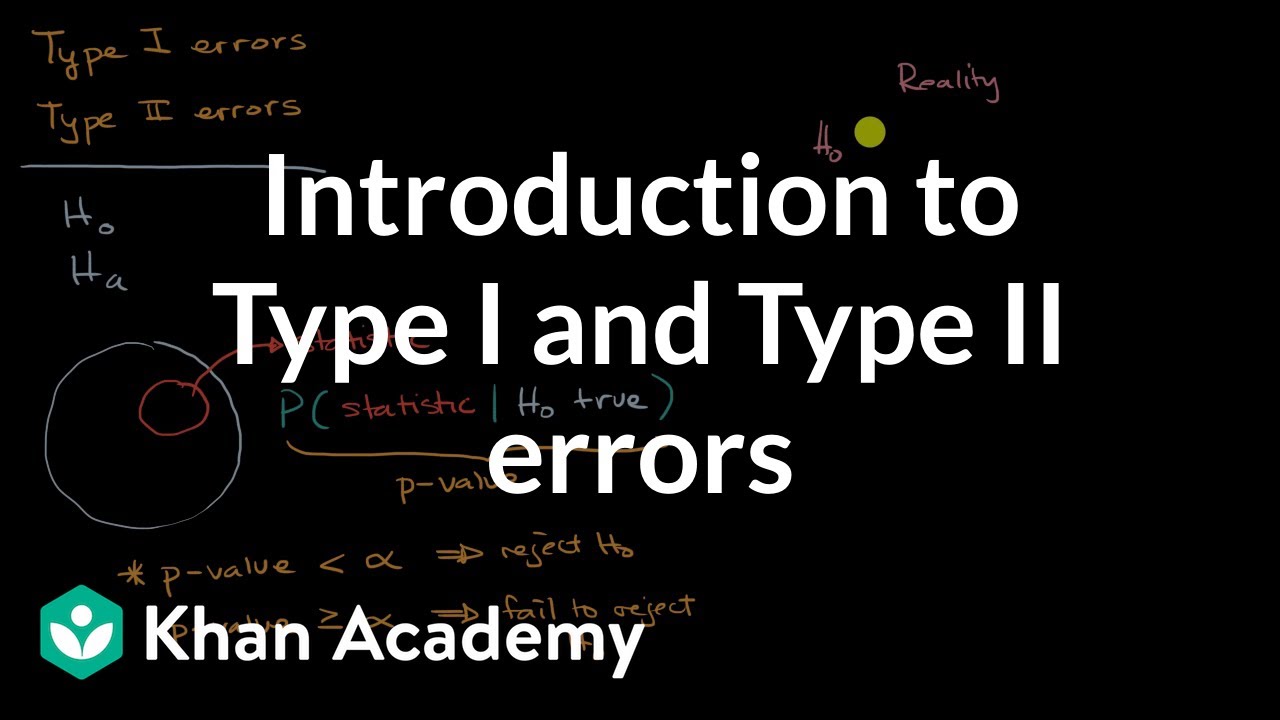
Introduction to Type I and Type II errors | AP Statistics | Khan Academy
Errors and Power in Hypothesis Testing | Statistics Tutorial #16 | MarinStatsLectures

How To Identify Type I and Type II Errors In Statistics
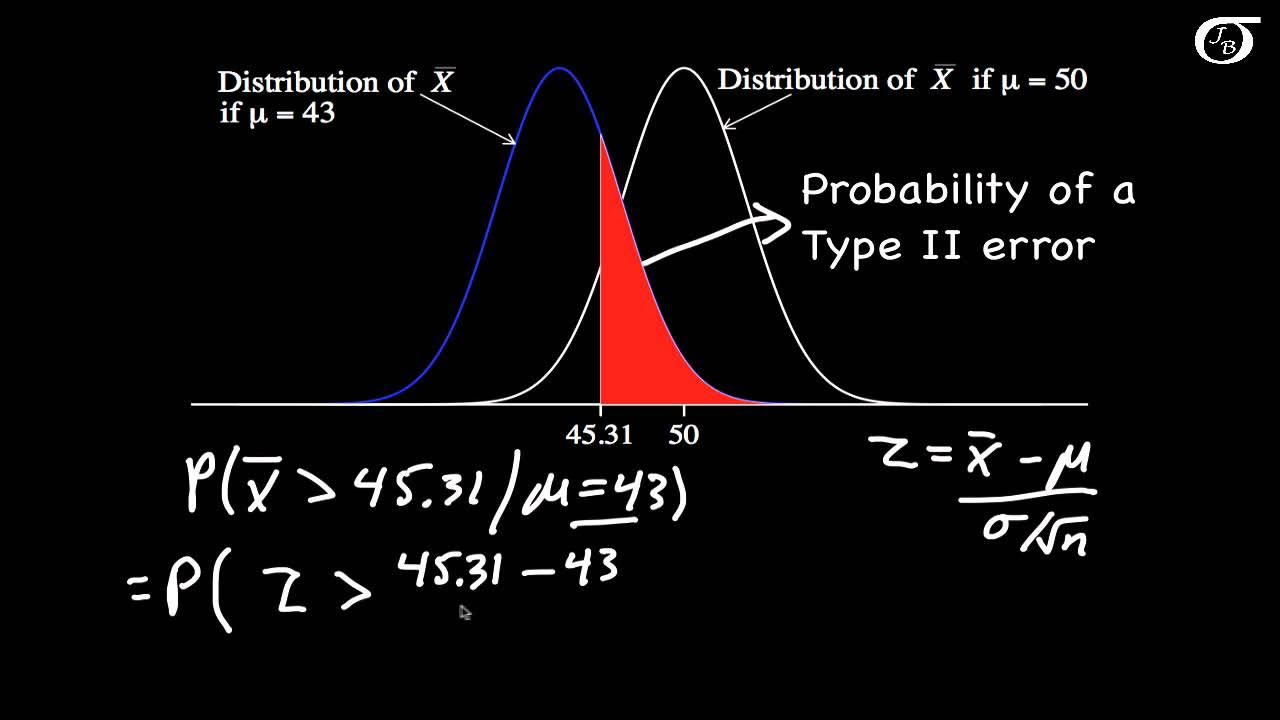
Calculating Power and the Probability of a Type II Error (A One-Tailed Example)
Type I error vs Type II error

P-values and significance tests | AP Statistics | Khan Academy
5.0 / 5 (0 votes)
Thanks for rating: