How to do a One-Way ANOVA in SPSS (12-6)
TLDRThe video script outlines a step-by-step guide to conducting a one-way ANOVA in SPSS using a fictional study about the prevalence of wicked witches in different regions of Oz. The process begins with data entry in SPSS, followed by setting up the variables and defining the levels for the 'region' factor. After entering the data, the dataset is saved as 'WickedWitch.sav'. The ANOVA analysis is then performed, with the 'complaints' variable as the dependent variable and 'region' as the factor. Post hoc tests, including Tukey and Games-Howell, are considered based on the assumption of equal variances, which is confirmed through Levene's test. The results of the ANOVA, including F-value, p-value, and effect size, are interpreted along with the post hoc comparisons to determine which regions significantly differ in terms of witch complaints. The summary also emphasizes the importance of not using raw SPSS output for APA formatted tables and provides an example of how to write up the results in APA style.
Takeaways
- 🧙♂️ The research story revolves around the Wizard of Oz investigating the prevalence of wicked witches in different regions to determine if there's a significant difference.
- 📊 A one-way ANOVA is conducted in SPSS to analyze if there's a difference in the number of complaints about wicked witches across four regions.
- 💻 The data set is created from scratch in SPSS, with 'region' as a nominal variable and 'complaints' as a scaled variable, both with no decimal places.
- 📝 The 'region' variable is labeled with 1 for North, 2 for South, 3 for East, and 4 for West, while 'complaints' is labeled as 'Complaints about wicked witches'.
- 🔢 Data for each region is entered in order, with the first five entries representing the North region, and so on for South, East, and West.
- 💾 The data set is saved as 'WickedWitch.sav' on the desktop before running the ANOVA.
- 📋 The ANOVA process in SPSS involves moving the 'complaints' variable to the dependent list and 'region' to the factor, without defining groups manually.
- 📉 Post hoc tests are considered, with Tukey selected for equal variances and Games-Howell as an alternative for unequal variances.
- 🔍 Assumptions for ANOVA, such as homogeneity of variances tested by Levene's test, are checked before interpreting the results.
- 📊 Descriptive statistics, including means, standard deviations, and sample sizes, are provided for each region in the output.
- 📝 The results are interpreted based on the F value, p-value, and eta squared for effect size, with significant findings indicated by p < .05.
Q & A
What statistical test is being conducted in the provided transcript?
-The statistical test being conducted is a one-way ANOVA (Analysis of Variance) in SPSS.
What is the research story behind the one-way ANOVA in the script?
-The research story involves the wizard of Oz investigating if certain regions have more problems with wicked witches than others, based on the number of complaints received from randomly surveyed munchkins.
How many regions were surveyed in the study about wicked witches?
-Four regions were surveyed: North, South, East, and West.
What are the two variables created in SPSS for this study?
-The two variables created are 'region', which is nominal, and 'complaints', which is scaled.
What are the labels assigned to the 'region' variable in the study?
-The labels assigned are 1 for North region, 2 for South region, 3 for East region, and 4 for West region.
What is the dependent variable in the one-way ANOVA conducted in the script?
-The dependent variable is 'complaints', which is the scale variable.
What is the factor variable in the one-way ANOVA?
-The factor variable is 'region', which is the categorical variable.
What post hoc tests are mentioned for analyzing differences between groups after ANOVA?
-Tukey's post hoc test is mentioned for equal variances, and Games-Howell is suggested if the assumption of homogeneity of variances is violated.
What assumption of ANOVA is checked using Levene's test?
-Levene's test checks the assumption of homogeneity of variances among the groups.
What does the output of Levene's test indicate about the variances of the groups in the study?
-The output indicates that the variances are homogeneous, as Levene's statistic is not significant (p = .918).
How should the results of the F test be reported in APA style?
-The results should be reported as F(3, 16) = 10.49, p < .05.
What does the eta squared value represent in the context of ANOVA?
-Eta squared represents the effect size of the ANOVA, indicating the proportion of variance in the dependent variable that is accounted for by the independent variable.
What does the Welch's robust test for equality of means indicate?
-Welch's ANOVA is used as a robust test when the assumption of homogeneity of variances is violated. It provides an alternative F value and significance level.
How are the post hoc results used to determine which regions differ significantly?
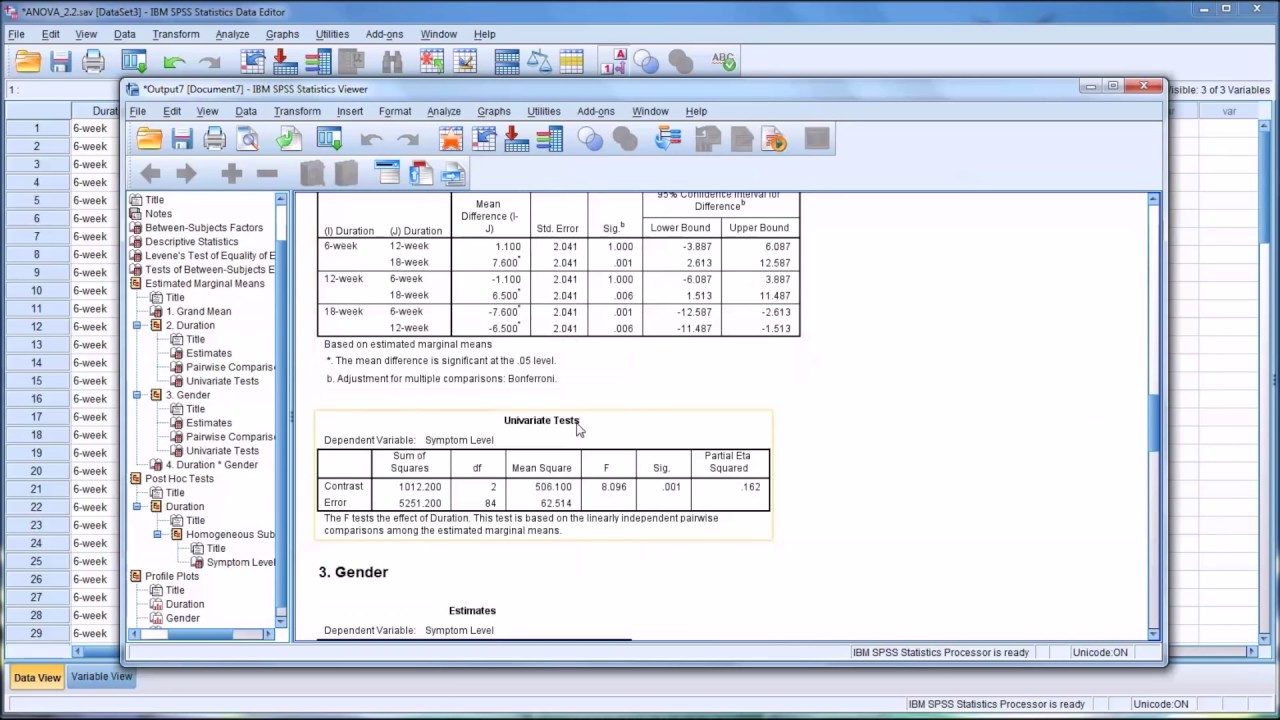
-The post hoc results show mean differences and significance values for each comparison. Regions with a p-value less than .05 are considered statistically different.
What does the homogeneous subsets output in SPSS indicate?
-The homogeneous subsets output groups regions that do not differ significantly from each other, allowing for the identification of similar and different groups based on the dependent variable.
How can the results of the one-way ANOVA be written up in APA style?
-The results should include the means and standard deviations for each group, the F value, degrees of freedom, p-value, and any significant post hoc comparisons, followed by an interpretation of the findings in the discussion section.
Outlines
🧙♂️ Conducting a One-Way ANOVA in SPSS
The script begins with an introduction to conducting a one-way ANOVA in SPSS using a small dataset about complaints regarding wicked witches in the wizard of Oz. The data will be entered from scratch, and the variables 'region' (nominal) and 'complaints' (scaled) are defined with no decimal places. The regions are labeled numerically, and data entry for each region's complaints is described. The process includes saving the dataset as 'WickedWitch.sav' and setting up the ANOVA by selecting the dependent variable 'complaints' and the factor 'region'. Post hoc tests are discussed, with Tukey's test chosen for equal sample sizes and Games-Howell as an alternative for unequal variances. The user is guided through the SPSS menu options to set up the ANOVA, including descriptive statistics, Levene's test for homogeneity of variance, and a means plot.
📊 Interpreting ANOVA Results and Assumptions
This paragraph delves into interpreting the ANOVA results, starting with descriptive statistics for each region, including sample size, mean, standard deviation, and confidence intervals. The focus then shifts to checking the assumptions of the ANOVA, specifically homogeneity of variances through Levene's test. The script confirms that the assumption holds as Levene's test is not significant. The F table is discussed, noting discrepancies in column order compared to APA style and the importance of formatting raw SPSS output. The script guides on how to report the ANOVA results, including the F value, degrees of freedom, and p-value, and introduces eta squared as an effect size measure. The output also includes Welch's robust test for equality of means, which would be considered if the homogeneity of variance assumption was violated. The post hoc results are explained, showing mean differences and significance values for region comparisons, and the script concludes with how to interpret and write up the results in APA style, including homogeneous subsets indicating regions with similar mean complaints.
📝 Writing Up APA Style Results for ANOVA
The final paragraph provides a detailed guide on how to write up the results of the ANOVA in APA style. It emphasizes the importance of including means and standard deviations from the descriptive statistics section and suggests grouping regions into 'Low Complaints' and 'High Complaints' based on their mean values. The script outlines the significance of the differences between these groups and clarifies that regions within the same group are not significantly different from each other. The paragraph concludes with an example write-up, which includes the statistical results and a brief discussion on the implications of the findings, noting that such a discussion would typically be placed in the paper's discussion section.
Mindmap
Keywords
💡ANOVA
💡SPSS
💡Nominal variable
💡Scaled variable
💡One-way ANOVA
💡Post Hoc Test
💡Assumptions of ANOVA
💡Levene's Test
💡Eta Squared
💡Descriptive Statistics
💡Homogeneous Subsets
Highlights
Conducting a one-way ANOVA in SPSS using a small dataset to analyze the number of complaints about wicked witches in different regions of Oz.
Creating a new dataset in SPSS with two variables: 'region' (nominal) and 'complaints' (scaled), both with decimals set to 0.
Defining region labels as 1 for North, 2 for South, 3 for East, and 4 for West region.
Entering data for each region in Data View and associating the first five entries with the North region, followed by South, East, and West.
Saving the dataset as 'WickedWitch.sav' on the desktop before running the one-way ANOVA.
Selecting 'Complaints' as the dependent variable and 'region' as the factor for the ANOVA test.
Choosing Tukey as the post hoc test due to equal participant numbers in each region, with an alternative of Games-Howell for unequal variances.
Requesting descriptive statistics, Levene's test for homogeneity of variance, Welch's test, and a means plot as part of the ANOVA options.
Interpreting the output with a focus on descriptive statistics, including sample size, mean, standard deviation, and standard error of the mean for each group.
Checking the assumption of homogeneity of variances using Levene's test, which was found to be non-significant (p = .918).
Reporting the ANOVA results with the F value (10.49), degrees of freedom (3 and 16), and p-value (p < .05).
Noting the use of Welch's ANOVA and Games-Howell post hoc if the assumption of homogeneity of variance had been violated.
Identifying significant differences between regions using post hoc tests, with the North and South regions not differing, but differing from East and West.
Using SPSS output to create homogeneous subsets to identify which regions are significantly different from each other.
Describing the results in APA style, including means, standard deviations, and the significance of findings between the 'Low Complaints' and 'High Complaints' groups.
Highlighting the practical application of the study in understanding regional differences in complaints about wicked witches in Oz.
Emphasizing the importance of properly formatting SPSS output for APA style and not using raw output directly.
Discussing the implications of the findings for the Wizard of Oz's understanding of regional issues with wicked witches.
Transcripts
Browse More Related Video

How To... Perform a One-Way ANOVA Test in SPSS
Conducting a Two-Way ANOVA in SPSS
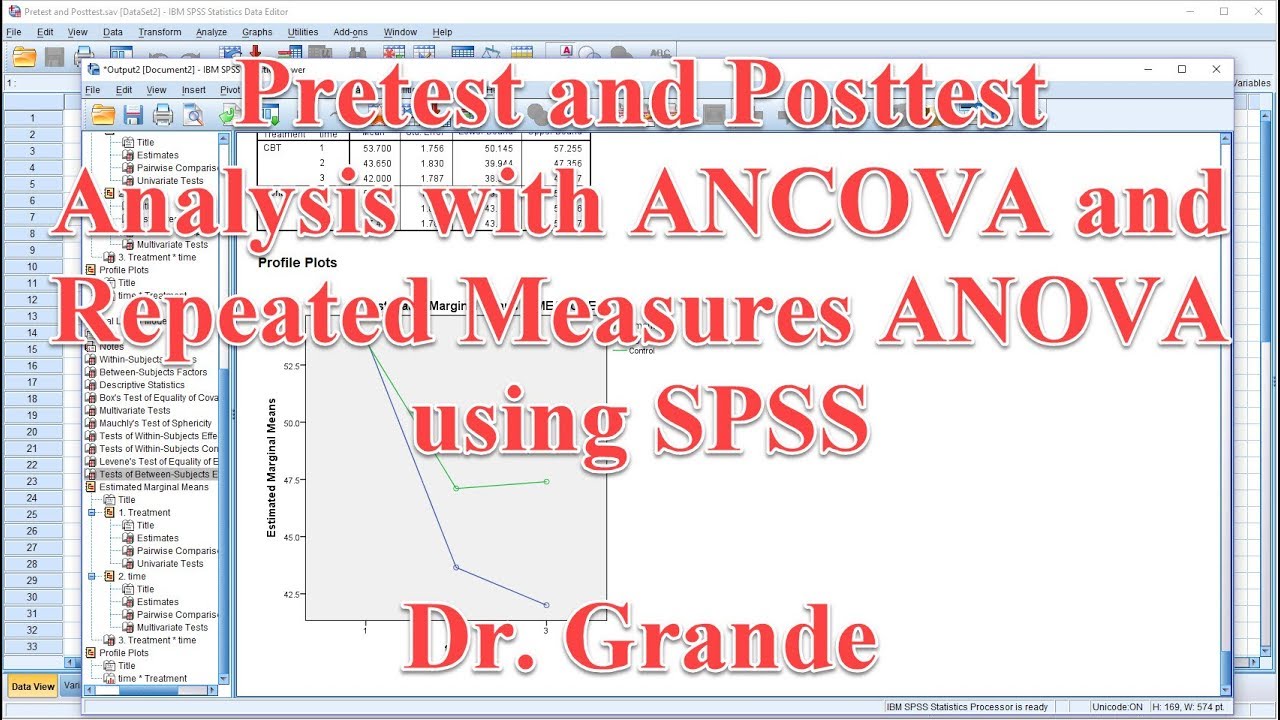
Pretest and Posttest Analysis with ANCOVA and Repeated Measures ANOVA using SPSS

SPSS One-way ANOVA: Post Hoc - Duncan test
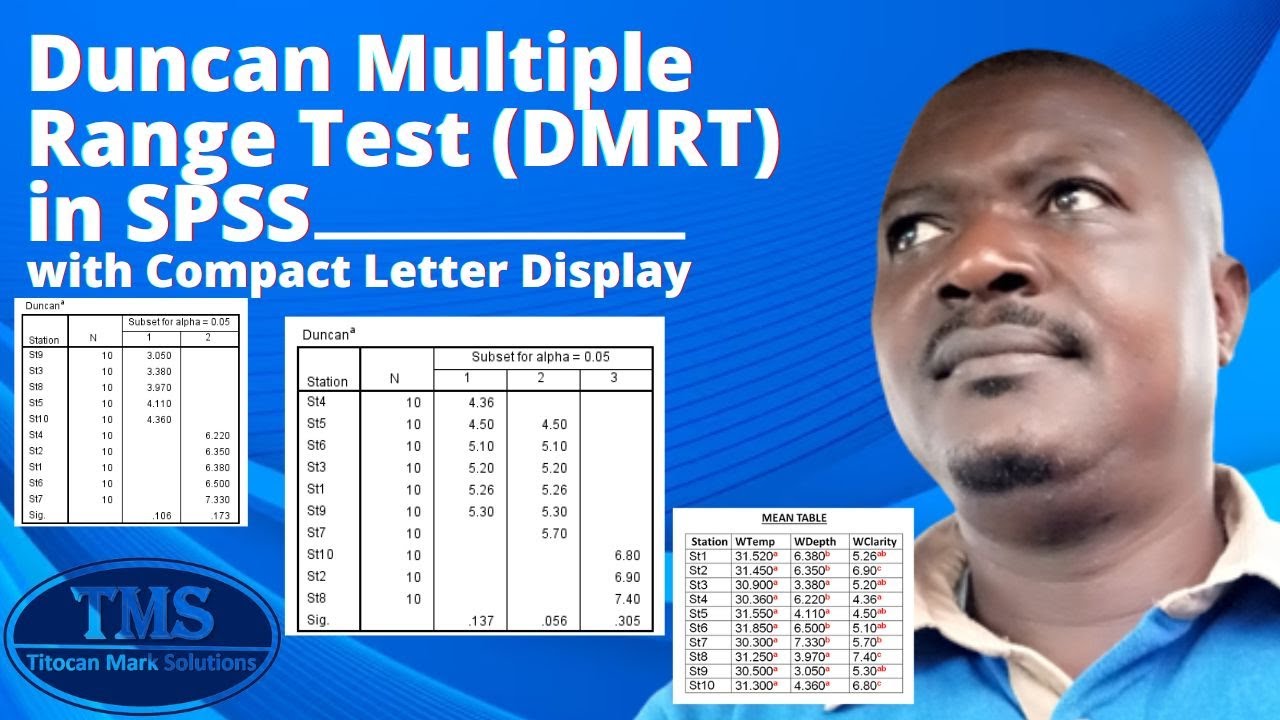
Duncan Multiple Range Test (DMRT) with Compact Letter Display
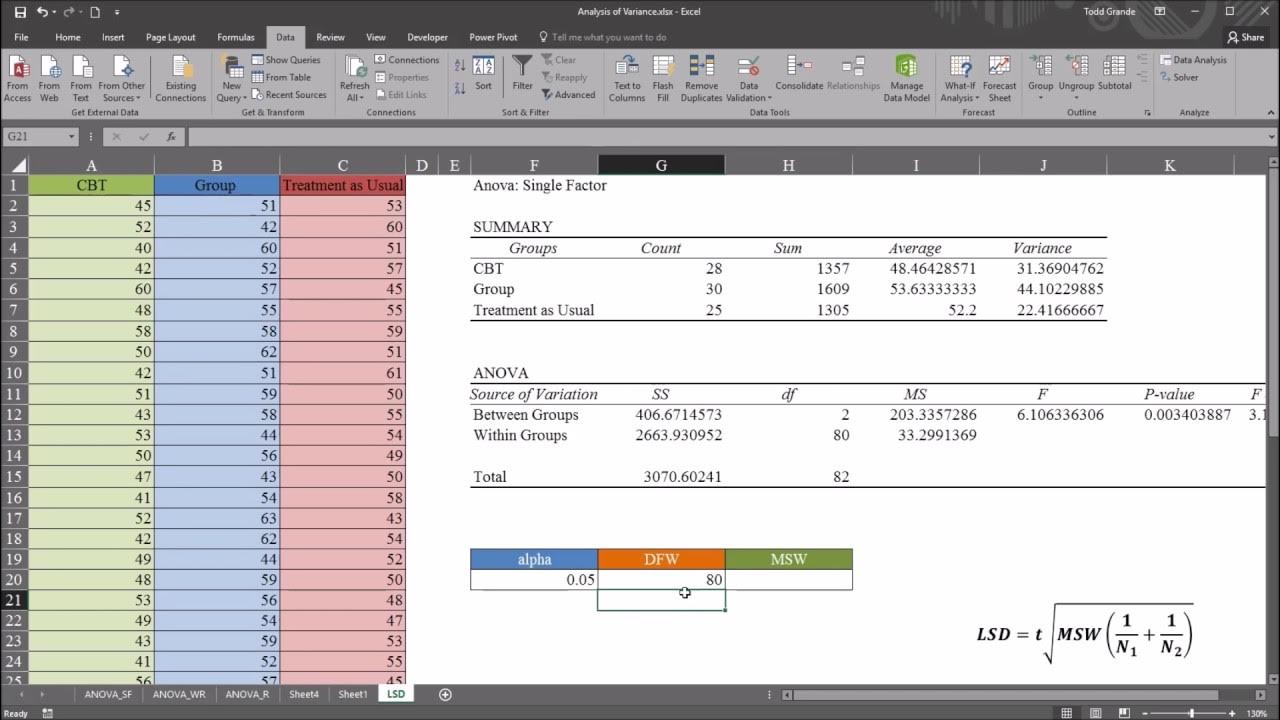
One-Way ANOVA with LSD (Least Significant Difference) Post Hoc Test in Excel
5.0 / 5 (0 votes)
Thanks for rating: