Conducting a Two-Way ANOVA in SPSS
TLDRDr. Grande's video tutorial offers a comprehensive guide on performing a two-way ANOVA using SPSS. The video explains the necessity of ANOVA over t-tests for analyzing data with multiple levels and interaction effects. It walks through the process of setting up the analysis, including plotting, post hoc tests, and interpreting the results, highlighting the significance of duration on symptom levels and the robustness of ANOVA despite variance assumption violations.
Takeaways
- 📚 The video is a tutorial on conducting a two-way ANOVA in SPSS, using fictitious data to demonstrate the process.
- 🔍 The study involves two independent variables: duration of counseling treatment with three levels (6, 12, and 18 weeks) and gender with two levels (male and female).
- 📊 The dependent variable measures symptom levels at the end of the study, with lower levels indicating fewer symptoms.
- ❌ A t-test is not suitable for this data setup because it can only handle two levels of an independent variable, whereas duration has three levels.
- ⚠️ Multiple t-tests increase the type 1 error rate, which is the risk of incorrectly rejecting a true null hypothesis.
- 🔄 ANOVA allows for the examination of interaction effects between variables, a feature not available with t-tests.
- 📈 The tutorial demonstrates how to set up and run a two-way ANOVA in SPSS, including how to plot and interpret the results.
- 📉 The results show a significant main effect of duration on symptom levels and a significant interaction effect between duration and gender.
- 📝 The assumption of homogeneity of variances was violated, which is a limitation but two-way ANOVA is robust against this violation.
- 📋 Post hoc tests are discussed, with the recommendation of using the Tukey test for controlling type 1 errors when sample sizes are similar.
- 📊 The video concludes with the interpretation of the results, emphasizing the importance of graphical representation for aiding in the understanding of the data.
Q & A
What is the purpose of the video by Dr. Grande?
-The purpose of the video is to demonstrate how to conduct a two-way ANOVA using SPSS, with a focus on analyzing fictitious data involving two independent variables: duration of counseling treatment and gender.
Why is a two-way ANOVA more appropriate than a t-test for the given data set?
-A two-way ANOVA is more appropriate because the independent variable 'duration' has three levels (6, 12, and 18 weeks), which a t-test cannot handle directly. Additionally, a two-way ANOVA allows for the examination of interaction effects between the two independent variables, something a t-test cannot do.
What are the two independent variables in the study presented in the video?
-The two independent variables are 'duration' with three levels (6, 12, and 18 weeks) and 'gender' with two levels (male and female).
What is the dependent variable in the study?
-The dependent variable is the 'symptom level', which is a measure administered at the end of the study, with lower scores indicating fewer symptoms.
Why might running multiple t-tests be problematic?
-Running multiple t-tests can increase the Type 1 error rate, also known as the alpha error, which is the probability of incorrectly rejecting a true null hypothesis.
What is a Type 1 error in the context of statistical testing?
-A Type 1 error occurs when the null hypothesis is incorrectly rejected, meaning a statistically significant difference is found when in reality there is none.
What is the main effect in ANOVA?
-The main effect in ANOVA refers to the impact of a single independent variable on the dependent variable, ignoring any potential interaction with other variables.
What is an interaction effect in the context of ANOVA?
-An interaction effect in ANOVA is the effect that one independent variable has on the dependent variable that depends on the level of another independent variable.
What is the significance of the partial eta squared (partial η²) in ANOVA?
-The partial eta squared is a measure of effect size that indicates the proportion of variance in the dependent variable that can be attributed to a particular independent variable or interaction effect.
What does the Levene's test assess in the context of ANOVA?
-Levene's test assesses the homogeneity of variances assumption, determining whether the variances of the groups are equal, which is an important assumption for the validity of ANOVA results.
What is the post hoc test used in the video, and why was it chosen?
-The post hoc test used in the video is the Tukey's Honestly Significant Difference (HSD) test, chosen because it offers good control of Type 1 errors and good statistical power when sample sizes are similar.
What does the significant interaction effect between duration and gender suggest?
-A significant interaction effect suggests that the impact of one independent variable on the dependent variable (symptom level) is different at different levels of the other independent variable (gender).
How does the video script interpret the results of the two-way ANOVA?
-The script interprets the results by examining the main effects and interaction effects, noting that the duration has a significant main effect and a significant interaction effect with gender. It also discusses the implications of these findings for the effectiveness of counseling treatment durations for males and females.
Outlines
📚 Introduction to Two-Way ANOVA in SPSS
Dr. Grande introduces a tutorial on conducting a two-way ANOVA using SPSS. The video presents fictitious data with two independent variables: the duration of counseling treatment with three levels (6, 12, and 18 weeks) and gender with two levels (male and female). The dependent variable measures symptom levels, with lower scores indicating fewer symptoms. The video explains why a t-test is not suitable for this data due to the three-level independent variable and the increased risk of type 1 error with multiple testing. It also highlights the advantage of ANOVA in examining interaction effects between duration and gender, which a t-test cannot do. The tutorial proceeds with a step-by-step guide on setting up the ANOVA in SPSS, including selecting the dependent variable, independent variables, and plotting the data.
📉 Analyzing Two-Way ANOVA Results and Post Hoc Tests
This paragraph delves into the results of the two-way ANOVA, including the significance of the main effects of duration and gender, and the interaction effect between them. It discusses the importance of post hoc tests, particularly for the duration variable, to control type 1 errors and ensure statistical power. The video explains the selection of the re g WQ post hoc test for its balance between type 1 error control and power when sample sizes are similar. It also covers the settings for saving the analysis, such as means for different levels of the independent variables, and the choice of confidence interval adjustments. The results show a significant effect of duration on symptom levels, but not of gender, with a notable interaction effect between duration and gender that accounts for a larger percentage of variance than duration alone.
📊 Interpreting Pairwise Comparisons and Interaction Effects
The video script moves on to interpret the results of pairwise comparisons, highlighting significant differences between the levels of the duration variable on symptom levels. It notes the lack of significant difference between the six and twelve-week durations, but significant differences between the six and eighteen-week, and twelve and eighteen-week durations. The script also discusses the means for males and females, indicating no significant difference by gender. The interaction effect of duration times gender is further explored, with specific attention to the low symptom level scores for the 18-week male group and the 12-week female group. The video emphasizes the importance of graphical representation, such as profile plots, in aiding the interpretation of results, showing distinct patterns in symptom level reduction across different groups.
🔍 Conclusion and Application of Two-Way ANOVA Findings
In the final paragraph, Dr. Grande summarizes the findings of the two-way ANOVA, suggesting that females may benefit most from a 12-week counseling treatment, while males might benefit more from an 18-week treatment. The video script reiterates the importance of understanding the data through both numerical results and graphical representations. It concludes by encouraging viewers to reach out with any questions or concerns, offering assistance in further understanding the process and interpretation of conducting a two-way ANOVA in SPSS.
Mindmap
Keywords
💡Two-way ANOVA
💡Independent Variables
💡Dependent Variable
💡Duration
💡Gender
💡Symptom Level
💡Main Effects
💡Interaction Effect
💡Type 1 Error
💡Post Hoc Test
💡Effect Size
💡Homogeneity of Variances
💡Profile Plots
Highlights
Introduction to conducting a two-way ANOVA using SPSS with fictitious data.
Explanation of two independent variables: duration of counseling treatment with three levels (6, 12, and 18 weeks) and gender with two levels (male and female).
Description of the dependent variable representing symptom levels measured at the end of the study, with lower levels indicating fewer symptoms.
Reasoning for not using a t-test due to the three levels of the duration variable and the limitations of t-tests in handling multiple levels.
Risk of increased Type 1 error rate when running multiple t-tests and the inability to study interaction effects.
Introduction of ANOVA's capability to analyze interaction effects between duration and gender.
Guidance on setting up the two-way ANOVA in SPSS, including the selection of dependent and independent variables.
Use of plots to visualize the effects of duration and gender on symptom levels.
Discussion on post hoc tests, specifically the use of the re g WQ test for controlling Type 1 errors and ensuring statistical power.
Selection of options for saving means, comparing main effects, and adjusting confidence intervals using LST to Bonferroni.
Presentation of the results, including sample sizes, means, and the significance of the Levene's test for homogeneity of variances.
Interpretation of the test of between-subjects effects, highlighting the significance of duration on symptom levels and the lack of significance for gender.
Analysis of the interaction effect between duration and gender, showing a significant impact on symptom levels.
Pairwise comparisons revealing significant differences between certain duration levels but not others.
Homogeneous subsets analysis indicating distinct groups based on duration.
Profile plots interpretation, visually demonstrating the effects of duration and gender on symptom levels.
Practical application of the findings to suggest that females benefit most from the 12-week group and males from the 18-week duration.
Emphasis on the importance of graphical representation for aiding in the interpretation of statistical results.
Conclusion and offer of assistance for any questions or concerns regarding the two-way ANOVA in SPSS.
Transcripts
Browse More Related Video
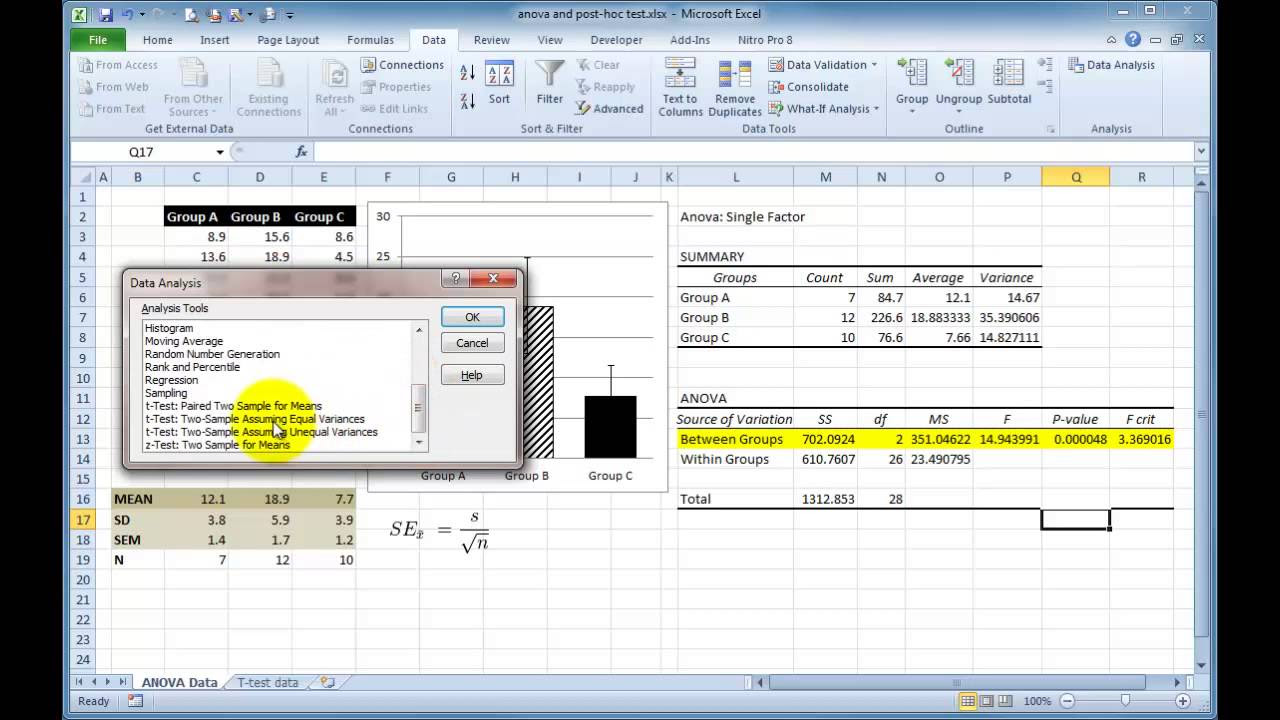
Performing a One-way ANOVA in Excel with post-hoc t-tests
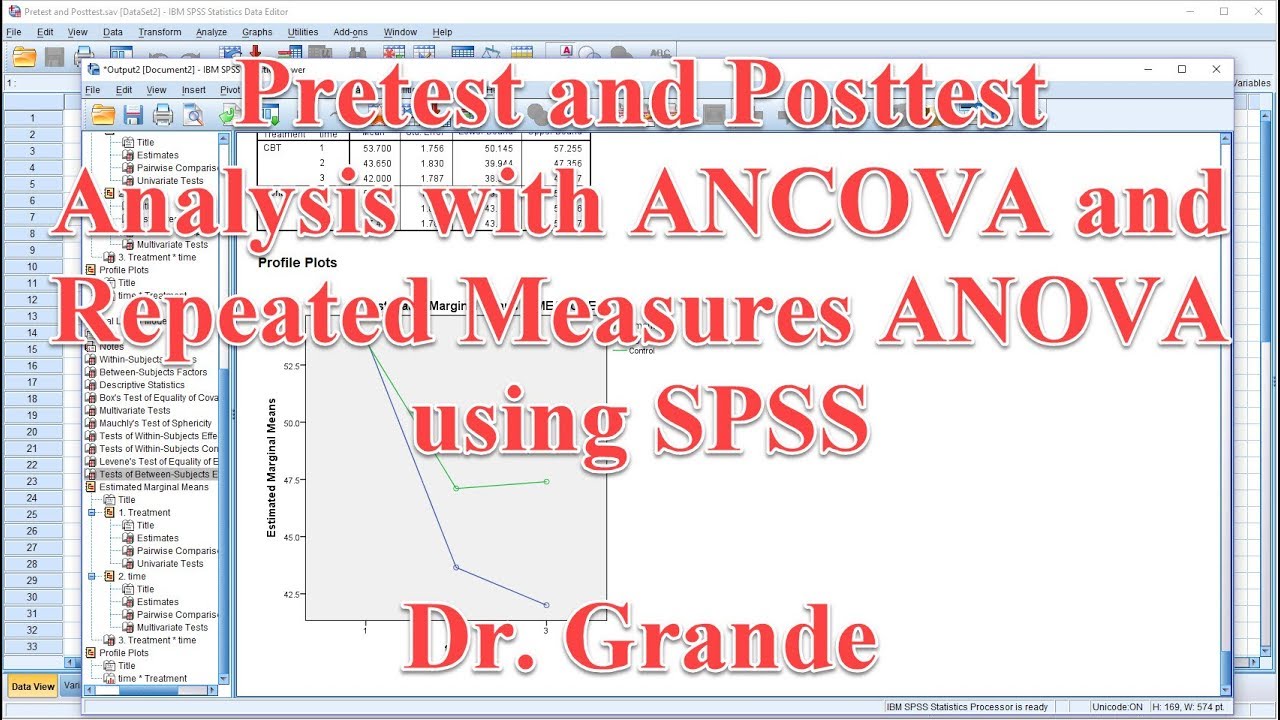
Pretest and Posttest Analysis with ANCOVA and Repeated Measures ANOVA using SPSS

SPSS (9): Mean Comparison Tests | T-tests, ANOVA & Post-Hoc tests
How to do a One-Way ANOVA in SPSS (12-6)

How To... Perform a One-Way ANOVA Test in SPSS

Mixed Design ANOVA
5.0 / 5 (0 votes)
Thanks for rating: