Duncan Multiple Range Test (DMRT) with Compact Letter Display
TLDRThis instructional video offers a step-by-step guide on conducting the Duncan Multiple Range Test in SPSS for post-hoc analysis of variance (ANOVA). It explains how to identify significant differences between group means using various post-hoc tests, focusing on the Duncan test for its advantages in handling large datasets and reducing Type I errors. The tutorial demonstrates how to interpret SPSS output, apply the compact letter display for easy identification of significant differences, and encourages viewers to subscribe for more educational content.
Takeaways
- 📚 The video is a tutorial on performing a postdoc test, specifically the Duncan Multiple Range Test, after one-way Analysis of Variance (ANOVA) in SPSS.
- 🔍 The purpose of a postdoc test is to identify where significant differences among group means lie after an ANOVA indicates there are differences but doesn't specify where.
- 📝 The script lists several postdoc tests, including Turkey, Docker, LSD, Bonferroni, Scheffe, and Duncan's tests, as methods for comparing statistical means within an experimental design.
- 🔢 The Duncan Multiple Range Test is particularly suitable for datasets with a large number of groups and pairs of means to compare, and it helps to lower the risk of committing a Type I error.
- 📋 The output of the Duncan test is presented in a Homogeneous Subset table, which shows groups with the same mean as not significantly different and those with different means as significantly different.
- 📈 The Compound Letter Display is a method used to easily identify significant differences or similarities between means, using superscript letters.
- 📊 The video demonstrates how to perform the Duncan test in SPSS, including loading data, selecting the test, and interpreting the output.
- 📉 The p-value from the ANOVA table is crucial for determining if there's a significant difference among the means; values less than 0.05 indicate significance.
- 📝 The video provides a step-by-step guide on how to apply the Compound Letter Display to the results of the Duncan test for easy interpretation.
- 🔑 The video emphasizes the importance of not only looking at mean values but also considering the results of the ANOVA to confirm significant differences.
- 👍 The tutorial aims to help viewers replicate the procedures to perform the Duncan Multiple Range Test on their data and interpret it using the Compound Letter Display.
Q & A
What is the purpose of a postdoc test in the context of analysis of variance (ANOVA)?
-A postdoc test is used to identify where the significant differences among group means lie after performing a one-way ANOVA. ANOVA shows if there is a significant difference among the means but does not specify which means are different. Postdoc tests help to pinpoint these differences for more informed conclusions.
What are some of the postdoc tests mentioned in the script?
-The script mentions several postdoc tests including the Turkey test, Duncan's multiple range test, least square difference, Bonferroni, Scheffé, and Dunnett's tests, among others.
Why is the Duncan multiple range test preferred for datasets with a large number of groups?
-The Duncan multiple range test is preferred for datasets with many groups because it effectively compares larger pairs of means and reduces the risk of committing a Type I error, which is the incorrect rejection of the null hypothesis.
What is a homogeneous subset table, and how is it used in the Duncan multiple range test?
-A homogeneous subset table is a result of the Duncan multiple range test that shows which groups have the same mean and are not significantly different, and which ones have different means and are significantly different. It helps in easily identifying the similarities and differences among group means.
What is the significance of the compact letter display in presenting ANOVA results?
-The compact letter display is used to label the variables or group means with letters at the superscript position, making it easier to identify significant differences or similarities among the means. It simplifies the presentation of results by visually grouping similar means.
How is the significance level set in the Duncan multiple range test in SPSS?
-In the script, the significance level is set at 0.05 in the Duncan multiple range test dialog box in SPSS. This is a conventional alpha value that provides a balance between the risks of Type I and Type II errors.
What does the p-value in the ANOVA table indicate?
-The p-value in the ANOVA table indicates the probability that the observed differences among group means could have occurred by chance. If the p-value is less than 0.05, it suggests that there is a statistically significant difference among the means.
How can you interpret the results of the Duncan multiple range test for water temperature in the provided dataset?
-In the script, the Duncan multiple range test for water temperature shows only one subset with a p-value greater than 0.05, indicating that there is no significant difference in water temperature among the stations, meaning the water temperature is statistically the same across all stations.
What does it mean when there are repeated mean values in different subsets of the Duncan multiple range test?
-When there are repeated mean values in different subsets, it indicates that the groups represented by those means are not significantly different from each other. This is used to identify which groups share similar characteristics within the dataset.
How does the script guide the application of the compact letter display for water depth and water clarity?
-The script guides the application of the compact letter display by showing how to replace subset numbers with letters (A, B, C, etc.), and then using these letters as superscripts next to the mean values in a table. This method helps to visually distinguish between groups with similar and different mean values.
Outlines
📚 Introduction to Postdoc Tests in ANOVA Analysis
This paragraph introduces the concept of postdoc tests following a one-way ANOVA. The speaker explains that while ANOVA can show significant differences among group means, it does not specify where these differences lie. The paragraph outlines various postdoc tests, such as Tukey, Docker, and others, which are used to identify specific differences between group means. The importance of choosing the right test to avoid type 1 and type 2 errors is emphasized. The speaker also references a previous video for more details on postdoc tests and introduces the Docker multiple range test, which will be demonstrated in the video using SPSS.
🔍 Demonstrating Docker Multiple Range Test in SPSS
The speaker provides a step-by-step guide on how to perform a Docker multiple range test in SPSS, starting with loading the data and ensuring it meets ANOVA assumptions. The process includes selecting dependent variables, setting the independent variable, and choosing the Docker test as the postdoc analysis. The significance level is set at 0.05, and descriptive statistics are requested. The output includes a descriptive statistics table, ANOVA table, and the Docker test's homogeneous subset table, which will be interpreted in the following paragraphs.
📊 Interpreting Descriptive Statistics and ANOVA Results
This paragraph focuses on interpreting the descriptive statistics and ANOVA tables from the SPSS output. The speaker explains how to pivot the descriptive statistics table and extract relevant information such as mean values and standard deviations. The importance of checking the p-value in the ANOVA table to determine if there is a significant difference among the means is highlighted. The paragraph concludes with the observation that while the mean values for water temperature at different stations appear similar, a formal statistical test is required for a reliable conclusion.
📝 Applying Docker Multiple Range Test to Water Temperature Data
The speaker applies the Docker multiple range test to the water temperature data, noting that there is only one subset due to no significant difference (p-value > 0.05). The process of transferring the results to an Excel spreadsheet and applying the compact letter display method is demonstrated. This involves replacing subset numbers with letters (e.g., 'A') and marking mean values with these letters to indicate similarity across stations. The speaker emphasizes the ease of identifying non-significant differences with this method.
🌡️ Analyzing Water Depth Data with Docker Multiple Range Test
The analysis shifts to water depth data, where two subsets indicate potential differences between groups of stations. The speaker explains how to interpret the homogeneous subset table, apply the compact letter display method, and identify stations with similar and different water depths. The process involves copying the table, replacing subset numbers with letters ('A' and 'B'), and marking mean values accordingly. The resulting table with superscript letters visually represents the depth similarities and differences between stations.
💧 Assessing Water Clarity with Docker Multiple Range Test
The final paragraph addresses the water clarity data, which involves three subsets and a more complex application of the Docker multiple range test. The speaker explains the interpretation of the homogeneous subset table, identifying stations with similar and different water clarity levels. The process includes applying the compact letter display method with three letters ('A', 'B', and 'C'), which helps in visualizing the clarity differences across stations. The speaker concludes by summarizing the findings and encouraging viewers to replicate the analysis on their data.
🎓 Conclusion and Call to Action
In the concluding paragraph, the speaker summarizes the process of performing the Docker multiple range test in SPSS and interpreting the results with the compact letter display. They encourage viewers to apply the demonstrated procedures to their own data and invite feedback through likes and subscriptions. The call to action includes subscribing to the YouTube channel for more educational content, emphasizing the value of the tutorial and the speaker's commitment to educational outreach.
Mindmap
Keywords
💡Postdoc Test
💡Analysis of Variance (ANOVA)
💡Turkey's Test
💡Dunnett's Test
💡Least Square Difference
💡Fisher's Least Significant Difference (LSD)
💡Docker Multiple Range Test
💡Homogeneous Subset
💡Compact Letter Display
💡Type I and Type II Errors
💡Significance Level
Highlights
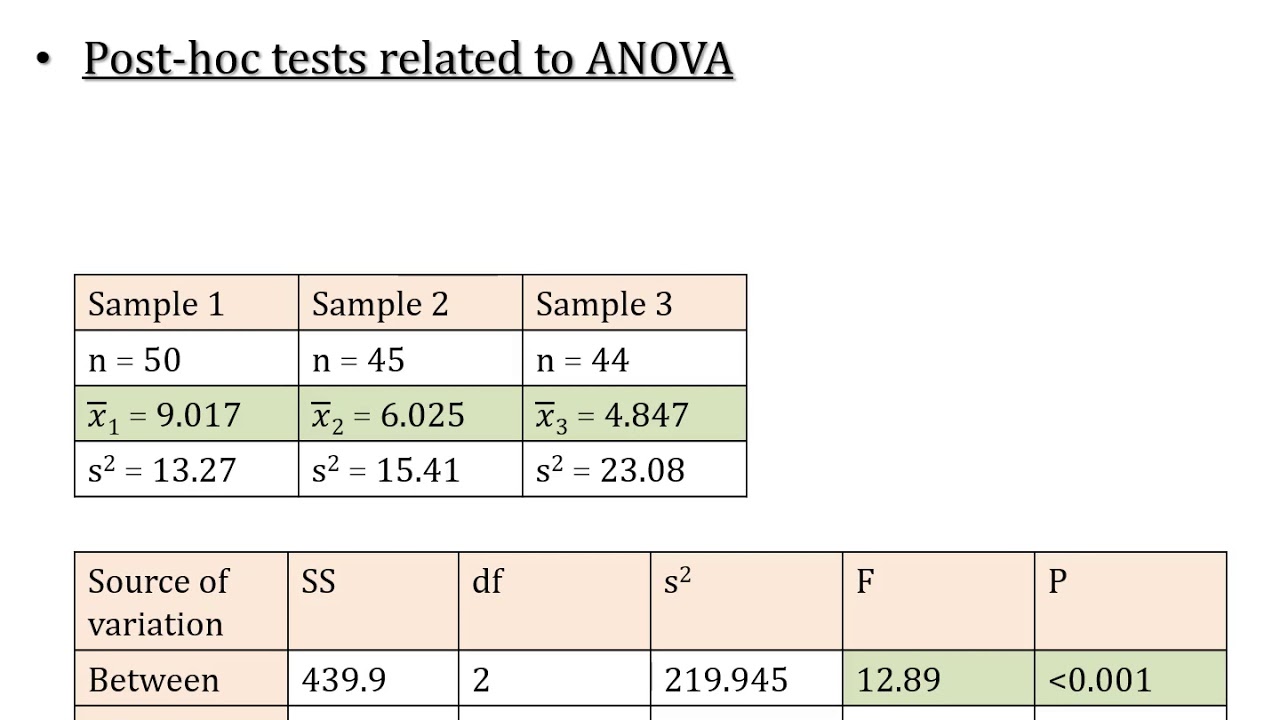
Introduction to postdoc tests for analysis of variance, explaining their importance in identifying specific differences among group means.
Overview of various postdoc tests including Turkey, Docker, Least Square Difference, Bonferroni, Scheffe, and Dunnett's tests.
Emphasis on choosing a suitable postdoc test for experimental design while considering type 1 and type 2 errors.
Explanation of the Docker multiple range test as a preferred method for datasets with many groups or treatments.
Advantages of the Docker multiple range test, such as reduced risk of type 1 error and clear output in homogeneous subset tables.
Introduction to the concept of homogeneous subset tables and their role in identifying non-significant differences among group means.
Discussion on the use of compact letter display for easy identification of significant differences in means.
Demonstration of how to perform a Docker multiple range test in SPSS, including navigating the software's interface.
Step-by-step guide on setting up a one-way ANOVA in SPSS for the Docker multiple range test.
Instructions on interpreting the descriptive statistics table and ANOVA table in SPSS for preliminary analysis.
How to apply the Docker multiple range test results to identify specific significant differences between pairs of means.
Application of the compound letter display method in Excel for presenting results clearly.
Example of applying the Docker multiple range test to water temperature data, showing no significant differences among stations.
Analysis of water depth data using the Docker test, revealing significant differences between certain station groups.
Interpretation of water clarity data with the Docker test, identifying specific stations with significantly different clarity levels.
Final demonstration of applying the compact letter display to water clarity data for easy comparison of results.
Conclusion summarizing the process of performing and interpreting Docker multiple range tests in SPSS with practical examples.
Encouragement for viewers to replicate the demonstrated procedures for their own data analysis in SPSS.
Transcripts
Browse More Related Video

SPSS One-way ANOVA: Post Hoc - Duncan test
LSD; Least Significant Difference; Post Hoc Test of ANOVA; Comparison of Means (Part A)
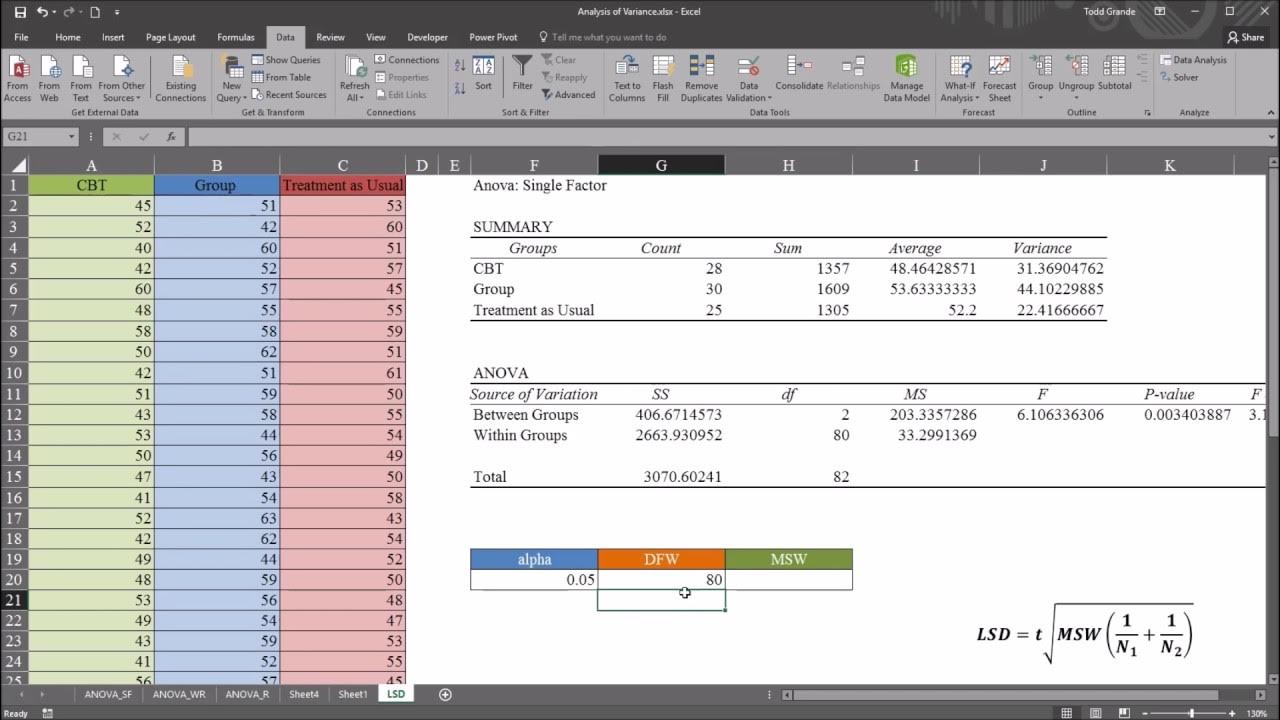
One-Way ANOVA with LSD (Least Significant Difference) Post Hoc Test in Excel

Understanding Analysis of Variance (ANOVA) including Excel - Statistics Help
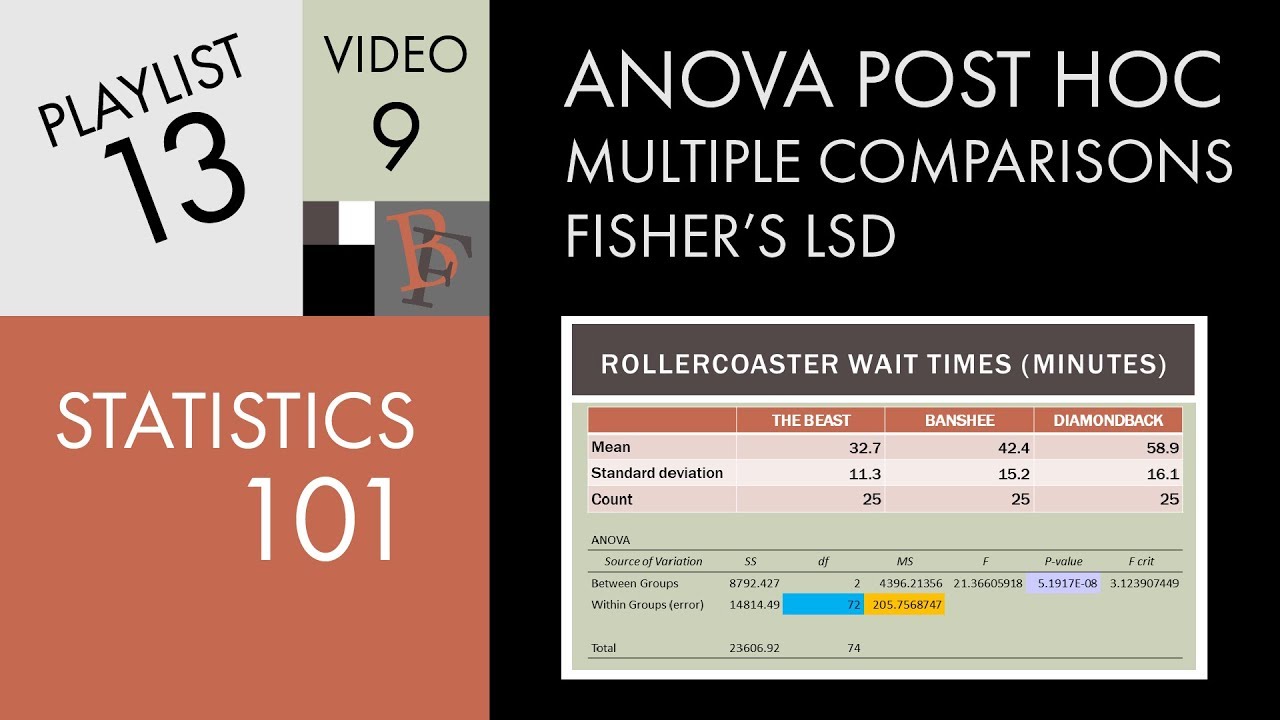
Statistics 101: ANOVA Post Hoc Test (Fisher's LSD)
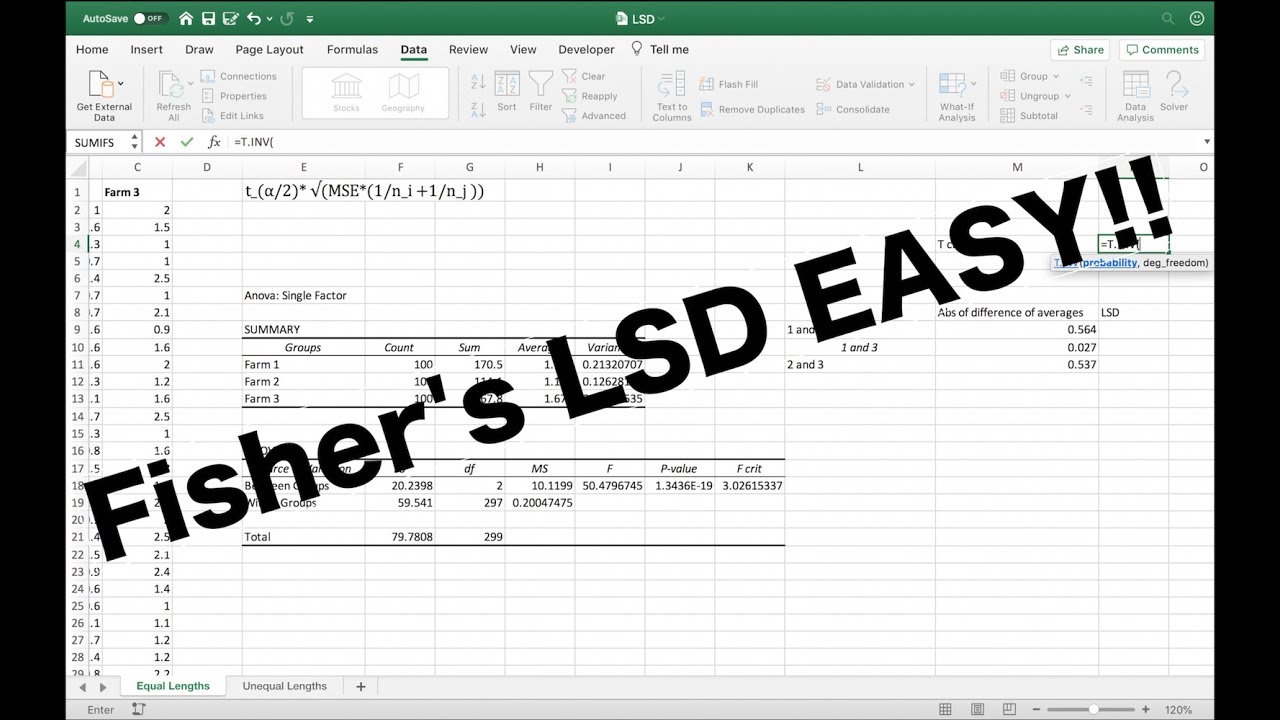
Fisher's LSD Explained
5.0 / 5 (0 votes)
Thanks for rating: