How To... Perform a One-Way ANOVA Test in SPSS
TLDRIn this educational video, Eugenia Rock from the National College of Ireland guides viewers through performing a one-way ANOVA test using SPSS. She begins by explaining the concept and setting up a hypothetical scenario involving three different course delivery methods and their impact on test scores. Eugenia demonstrates how to import data from Excel, reformat it for analysis, and interpret the results of the ANOVA test, including setting up null and alternative hypotheses. She also covers post-hoc tests to identify which groups differ significantly. The video is a practical tutorial for those looking to understand statistical analysis in SPSS.
Takeaways
- 📚 Eugenia Rock introduces a series of how-to videos on statistical analysis, focusing on a one-way ANOVA test in this session.
- 📈 The context for the ANOVA test is to compare test scores of students in three different course delivery methods: classroom only, online only, and blended learning.
- ⚖️ The null hypothesis states that there's no difference between the means of the three groups, while the alternative hypothesis suggests at least two means are different.
- 📊 Data is prepared and stored in an Excel file, which is then imported into SPSS for analysis.
- 🔄 Initially, the data is in three separate columns, which needs to be rearranged into one column with 30 values to perform the ANOVA test.
- 📝 A new variable 'group' is created to identify to which group each data point belongs (classroom, online, or blended learning).
- 🔢 Values and labels are assigned to the 'group' variable to differentiate between the three groups in the dataset.
- 🧐 The one-way ANOVA test is conducted by selecting the 'Analyze', 'Compare Means', and then 'One-Way ANOVA' options in SPSS.
- 📉 The test results include an F statistic and a significance (p-value), which are used to determine whether to reject the null hypothesis.
- 🔎 A post hoc test (Tukey's HSD) is used to identify which specific groups are significantly different from each other after the ANOVA test indicates an overall difference.
- ✅ The results show significant differences between the classroom only and blended learning groups, as well as between the blended learning and online only groups.
- 📝 The video concludes with a demonstration of how to conduct a one-way ANOVA test in SPSS and how to interpret the results.
Q & A
What is the purpose of the video?
-The purpose of the video is to teach viewers how to perform a one-way ANOVA test in SPSS using sample data related to different course delivery methods.
What are the three different course delivery methods mentioned in the sample data?
-The three different course delivery methods mentioned are classroom only, online only, and a blend of both classroom and online.
What is the null hypothesis in the context of this video?
-The null hypothesis is that the mean test scores of the classroom group are equal to the mean test scores of the online group, which is also equal to the mean test scores of the blended group, indicating no difference between the means of the three groups.
What is the alternative hypothesis presented in the video?
-The alternative hypothesis (H1) is that the mean of the classroom group is not equal to the mean of the online group, which is not equal to the mean of the blended group, suggesting that at least two of the means are different.
How does the video guide the process of importing data from an Excel file into SPSS?
-The video instructs to open SPSS, go to File > Open, select the Excel file, ensure 'Read variable names from the first row of data' is checked, and then open the file to import the data into the SPSS Data Editor.
Why is it necessary to restructure the data from three columns to one column in SPSS?
-It is necessary to restructure the data because ANOVA requires all values to be in one column to compare the means across different groups effectively.
How does the video describe creating a new variable in SPSS to differentiate the three groups?
-The video describes creating a new variable called 'group' with values 1, 2, and 3, each representing one of the three groups: classroom only, online only, and blended learning, respectively.
What is the significance of the F statistic and p-value in the ANOVA test results shown in the video?
-The F statistic measures the variance between the group means, and the p-value indicates the probability that the observed differences occurred by chance. If the p-value is less than the alpha level (commonly 0.05), it suggests that there is a significant difference between the group means.
What additional analysis does the video suggest to determine which groups are significantly different after an ANOVA test?
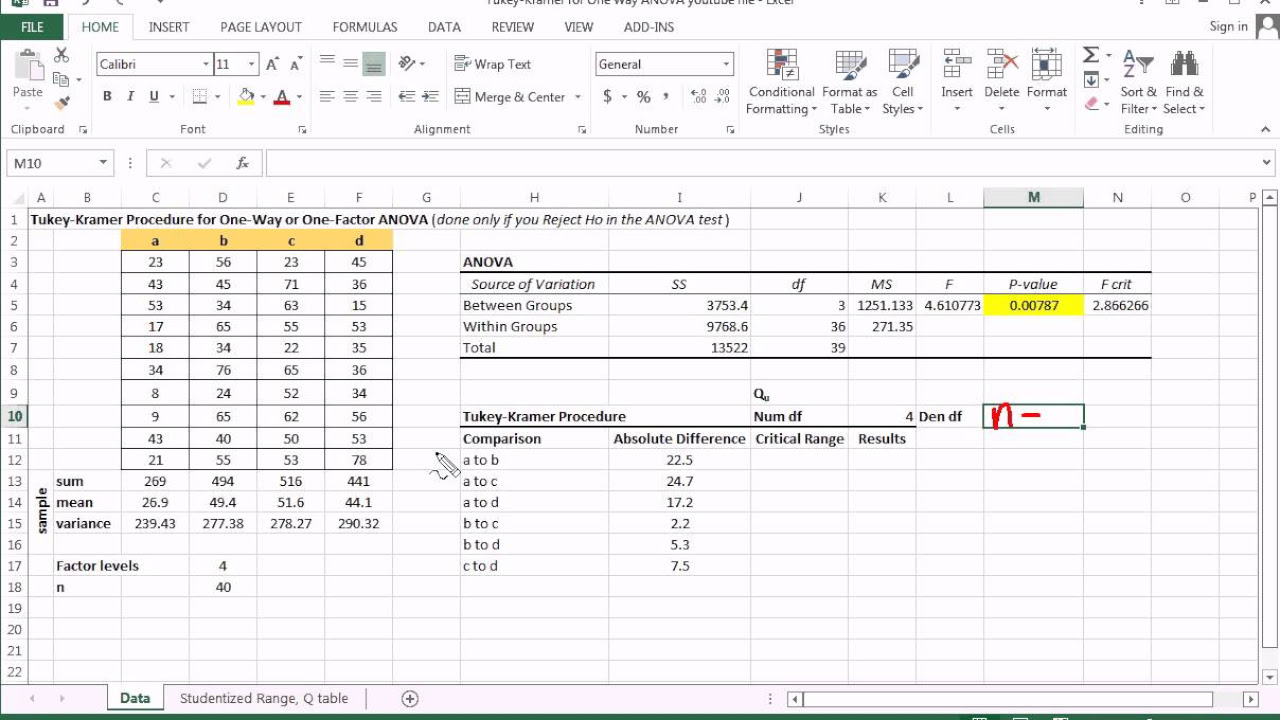
-The video suggests running a post hoc test, specifically the Tukey's HSD (Honestly Significant Difference) test, to determine which specific groups differ significantly from each other.
What conclusion does the post hoc test in the video indicate about the differences between the groups?
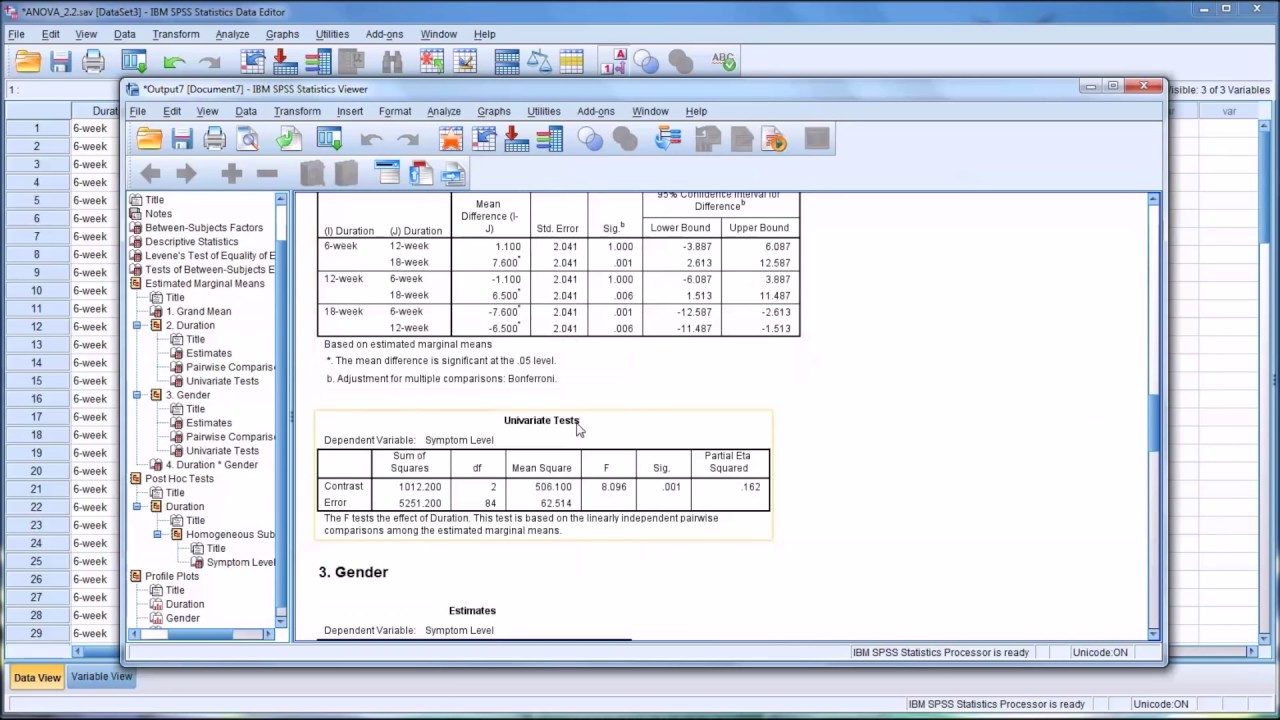
-The post hoc test indicates that there is a significant difference between the blended learning and the classroom only groups, as well as between the blended learning and the online only groups, as the p-values for these comparisons are less than 0.05.
Outlines
📚 Introduction to One-Way ANOVA Test in SPSS
In this first paragraph, Eugenia Rock introduces herself as a lecturer at the National College of Ireland and welcomes viewers to a series of how-to videos. The focus of this video is to learn how to perform a one-way ANOVA test using SPSS. She presents sample data involving three different course delivery methods: classroom only, online only, and a blend of both. The goal is to determine if there's a significant difference in test scores among these groups. Eugenia sets up the null hypothesis (no difference in means) and the alternative hypothesis (at least two means are different). She demonstrates how to prepare the data in an Excel file and import it into SPSS, explaining the process of reshaping the data from three columns to one and creating a new variable to identify the group each data point belongs to.
🔍 Setting Up the One-Way ANOVA Test in SPSS
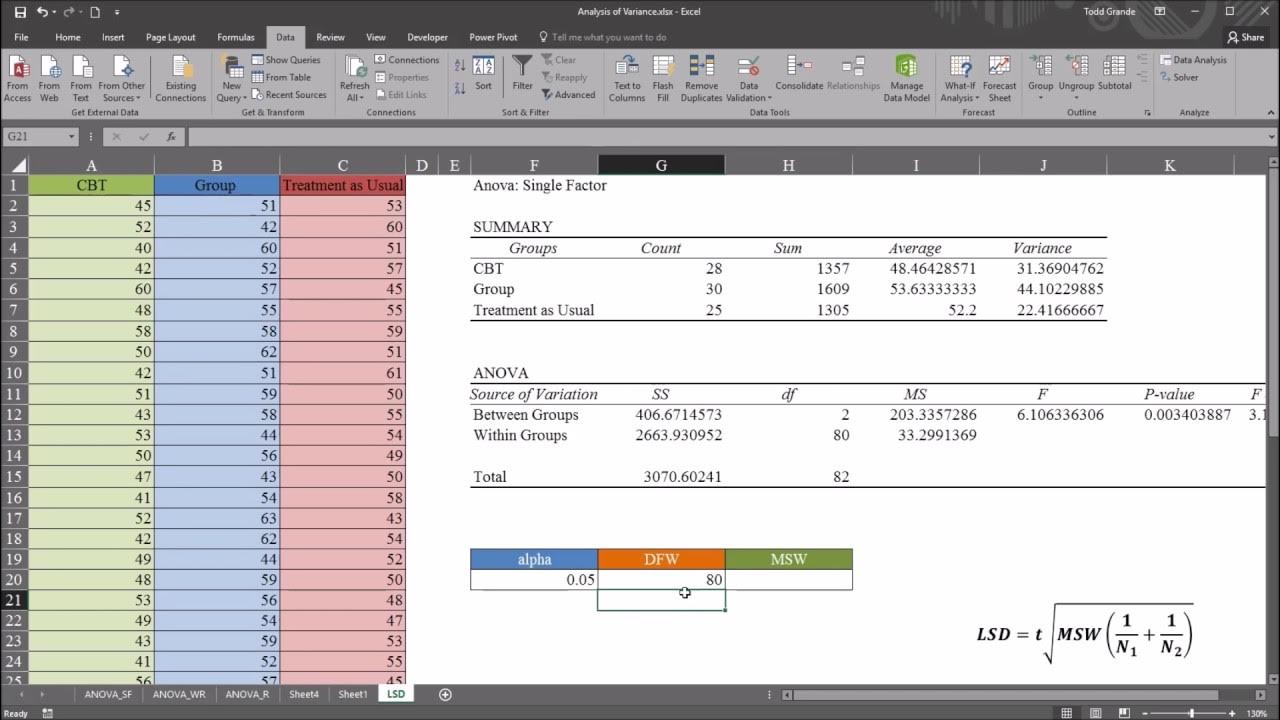
The second paragraph details the process of setting up the one-way ANOVA test within SPSS. Eugenia explains how to create a new variable named 'group' to categorize the data into three groups. She guides viewers on how to use the 'Values' feature to label each group with a corresponding number and name. After preparing the data, she moves on to the ANOVA test by selecting the 'Analyze' menu, choosing 'Compare Means,' and then 'One-Way ANOVA.' She emphasizes the importance of correctly identifying the dependent variable and the factor (group) before running the test. The paragraph concludes with the appearance of the ANOVA table, which includes sums of squares, degrees of freedom, mean square, the F statistic, and the significance (p-value).
📉 Analyzing Results and Conducting Post Hoc Tests
In the final paragraph, Eugenia discusses the results of the one-way ANOVA test, noting the F statistic and the p-value, which is less than 0.05, leading to the rejection of the null hypothesis. This indicates that there is a significant difference between at least two of the groups. To identify which groups are different, she performs post hoc tests using the Tukey's HSD method. The results of these tests reveal that there is no significant difference between the classroom only and online only groups, but there is a significant difference between the classroom only and blended learning groups, as well as between the blended learning and online only groups. Eugenia concludes by summarizing the steps to conduct a one-way ANOVA test in SPSS and thanks viewers for their attention.
Mindmap
Keywords
💡ANOVA test
💡SPSS
💡Null hypothesis
💡Alternative hypothesis
💡Excel file
💡Variable names
💡Data manipulation
💡Factor
💡Significance level
💡Post hoc test
Highlights
Introduction to a tutorial series on how to perform a one-way ANOVA test in SPSS by Eugenia Rock.
Explanation of a hypothetical scenario involving three different course delivery methods and their impact on test scores.
Presentation of the null hypothesis stating no difference between the means of the three groups.
Formulation of the alternative hypothesis suggesting at least two group means are different.
Demonstration of importing data from an Excel file into SPSS.
Instructions on adjusting data layout from three columns to one for ANOVA test compatibility.
Guidance on creating a new variable in SPSS to differentiate between the three groups.
Description of how to assign value labels to the groups in the dataset.
Process of manually entering group identifiers for each data point.
Tutorial on running the one-way ANOVA test in SPSS and interpreting the results.
Explanation of the ANOVA table, focusing on the F statistic and p-value.
Decision to reject the null hypothesis based on a p-value less than 0.05.
Introduction to post hoc tests to determine which groups differ significantly.
Selection and execution of the Tukey's HSD test for post hoc analysis.
Interpretation of post hoc test results to identify significant differences between specific groups.
Conclusion summarizing the steps to conduct a one-way ANOVA test in SPSS and the findings.
Transcripts
Browse More Related Video
How to do a One-Way ANOVA in SPSS (12-6)
One-Way ANOVA with LSD (Least Significant Difference) Post Hoc Test in Excel

SPSS One-way ANOVA: Post Hoc - Duncan test
Tukey Kramer Multiple Comparison Procedure and ANOVA with Excel
Conducting a Two-Way ANOVA in SPSS

SPSS (9): Mean Comparison Tests | T-tests, ANOVA & Post-Hoc tests
5.0 / 5 (0 votes)
Thanks for rating: