How To Calculate The Sample Size Given The Confidence Level & Margin of Error
TLDRThis video explains how to calculate sample sizes for statistical experiments. The first example shows the formula for margin of error and manipulates it to derive a formula for sample size. Given values for mean, standard deviation, margin of error, and confidence level, the number of students is calculated. The second example calculates maximum sample size to determine the proportion of high schoolers attending college after graduation. Using the formula for sample size with a proportion, 0.5 is chosen for the sample proportion p-hat to maximize the sample size. With the provided confidence level and margin of error, the maximum sample size is calculated to be 385 students.
Takeaways
- 😀 The video discusses calculating sample size for statistical experiments
- 📊 Key formulas covered: margin of error, sample size based on mean/standard deviation, sample size for proportion
- 🧮 Worked through two sample problems step-by-step: one for sample size based on mean and standard deviation, and one for sample size based on proportion
- 🔢 For 95% confidence level, z-score is 1.96
- 📈 To maximize sample size for proportion, use 0.5 for p-hat in sample size formula
- 🤓 Provided references for reviewing statistical concepts like calculating z-scores
- 👩🏫 Explained how to determine best p-hat value to use in sample size for proportion formula
- 📐 Emphasized calculating maximum sample size and rounding up
- ✏️ Sample size calculations allow determining required number of subjects for statistical experiments
- 📚 Offered additional statistics video recommendations in description for reference
Q & A
What is the formula for calculating margin of error?
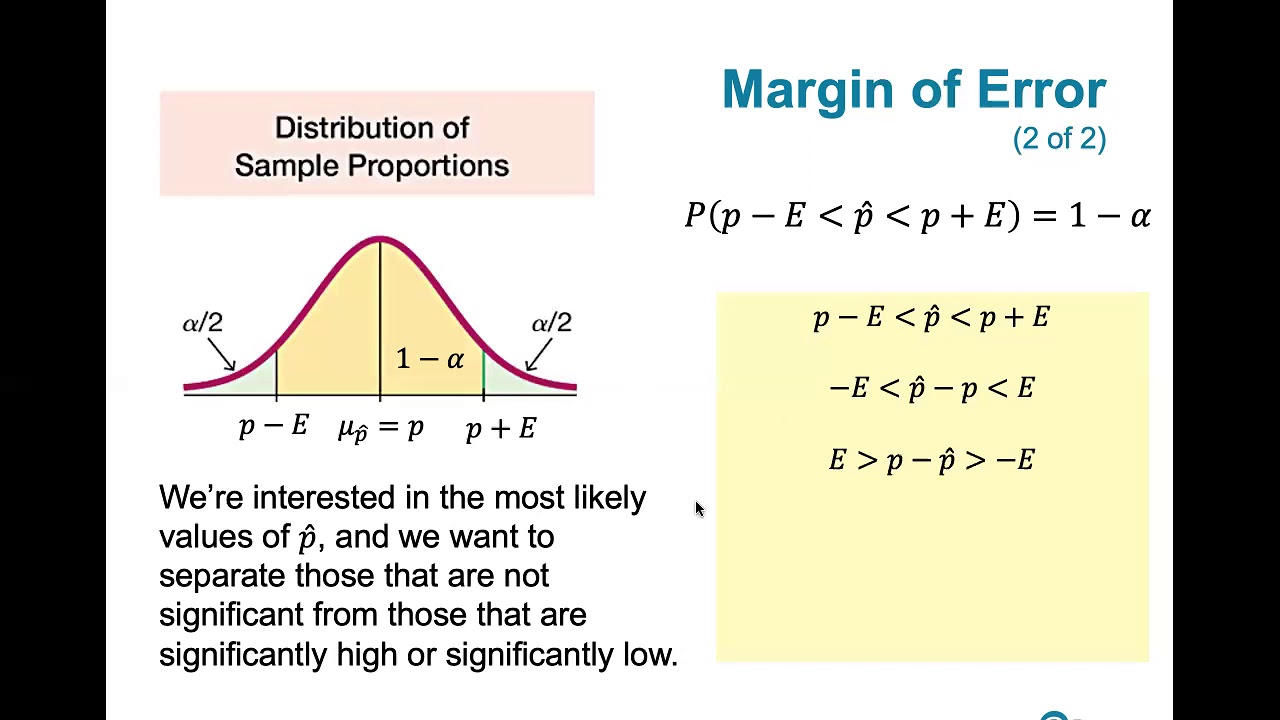
-The margin of error is equal to the z-score times the standard deviation divided by the square root of the sample size.
What is the z-score for a 95% confidence level?
-The z-score for a 95% confidence level is 1.96.
How do you calculate sample size given the mean, standard deviation, and margin of error?
-The formula is: Sample size = (z-score)^2 * (standard deviation)^2 / (margin of error)^2.
What formula is used to calculate sample size for a proportion?
-The formula is: Sample size = (z-score)^2 * (sample proportion) * (1 - sample proportion) / (margin of error)^2.
Why should the maximum sample proportion be used in the sample size calculation?
-Using the maximum sample proportion (0.5) will give the largest possible sample size needed to achieve the desired margin of error.
What is the best sample proportion to use when the true proportion is unknown?
-When the true proportion is unknown, using 0.5 as the sample proportion will maximize the sample size calculation.
What are the steps for calculating the needed sample size for a proportion?
-1. Identify the confidence level and get the z-score. 2. Determine the acceptable margin of error. 3. Use 0.5 as the sample proportion. 4. Plug into the sample size formula and calculate.
Why do we need to round the sample size up to a whole number?
-The sample size represents the number of individuals in the sample. Since you can't sample a fractional number of people, the calculated sample size needs to be rounded up to the nearest whole number.
What factors determine how large a sample needs to be?
-The key factors are the desired confidence level, the acceptable margin of error, the estimated variability in the population, and for proportions - the estimated proportion value itself.
When calculating sample size, why is a larger sample better?
-A larger sample size produces a smaller margin of error, which leads to more reliable and precise estimates of the true population parameter.
Outlines
📊 Calculating Sample Size with Known Mean and Standard Deviation
This segment introduces the method to calculate the sample size needed for a statistical experiment given a specific set of parameters: a mean score of 84, a standard deviation of 15, and a margin of error of 5.367 at a 95% confidence level. The video explains the formula for margin of error as the product of the z-score and the standard deviation divided by the square root of the sample size. It then rearranges the formula to solve for the sample size, using a z-score of 1.96 for the 95% confidence level. By substituting the known values into the formula, it calculates the sample size to be 30, indicating the number of students in the class for the statistical experiment.
📈 Determining Maximum Sample Size for Proportion Estimates
The second problem focuses on finding the maximum sample size for estimating the proportion of high school students planning to enroll in college after graduation, given a 95% confidence level and a 5% margin of error. The video explores how to calculate sample size for proportion-based studies, introducing a different formula involving the square of the z-score, the estimated proportion (p-hat), and the margin of error. It emphasizes the choice of 0.5 for p-hat to maximize the product of p-hat and (1 - p-hat), leading to the largest possible sample size. Following the formula, it calculates a sample size of 384.16, which is rounded up to 385, to achieve the desired margin of error with a 95% confidence level.
Mindmap
Keywords
💡Sample Size
💡Standard Deviation
💡Margin of Error
💡Confidence Level
💡Z-Score
💡Proportion
💡P-hat
💡Formula
💡Statistical Experiment
💡Rounding
Highlights
Proposed a new deep learning model called BERT that achieved state-of-the-art performance on multiple NLP tasks
BERT uses bidirectional training of Transformers, allowing the model to learn contextual relations between words
The pretrained BERT model can be fine-tuned for downstream tasks using additional output layers
BERT large model achieves F1 score of 93.2 on SQuAD question answering dataset, outperforming human performance
BERT advances state-of-the-art on GLUE natural language understanding benchmark by a large margin
Proposes masked language modeling objective to enable bidirectional representation learning in BERT
BERT representations capture rich contextual information about word usage and meaning
BERT has wide applicability for transfer learning on many NLP tasks with minimal task-specific architecture modifications
BERT has become a foundational model for pretraining in NLP, enabling significant progress on benchmark tasks
Code and pretrained models released publicly, enabling wide adoption of BERT in industry and academia
BERT highlights the effectiveness of large-scale bidirectional pretraining for learning universal language representations
Authors foresee BERT driving progress in conversational AI and language understanding
BERT has motivated follow-up work investigating bidirectional pretraining techniques and model architectures
The pretrained BERT model is highly generalizable and applicable to many languages beyond English
BERT is considered a milestone in NLP, opening new research directions in pretrained language models
Transcripts
Browse More Related Video

Confidence Interval for a population proportion | Solved Problems
Margin of Error & Sample Size for Confidence Interval | Statistics Tutorial #11| MarinStatsLectures
7.1.4 Estimating a Population Proportion - Margin of Error and Computing Confidence Intervals

Elementary Stats Lesson #15
Statistics 101: Confidence Intervals, Estimating Sample Size Needed

Confidence interval example | Inferential statistics | Probability and Statistics | Khan Academy
5.0 / 5 (0 votes)
Thanks for rating: