Confidence interval example | Inferential statistics | Probability and Statistics | Khan Academy
TLDRThe video script discusses a statistical problem where a 99% confidence interval is calculated for the proportion of teachers who believe computers are essential in their classrooms. It explains the concept of Bernoulli distribution, sample mean, and variance, and uses these to estimate the population proportion. The script guides through the steps of calculating the sample proportion, variance, and standard deviation, then uses a Z-table to determine the margin of error for the confidence interval. It concludes with the interval estimation and suggests increasing the sample size to narrow the interval while maintaining confidence.
Takeaways
- 💻 A technology grant is available for teachers to install clusters of four computers in their classrooms.
- 📊 250 out of 6,250 teachers were randomly selected to gauge their opinion on the necessity of computers as a teaching tool.
- 🗳️ 142 teachers from the surveyed group felt that computers were essential for teaching.
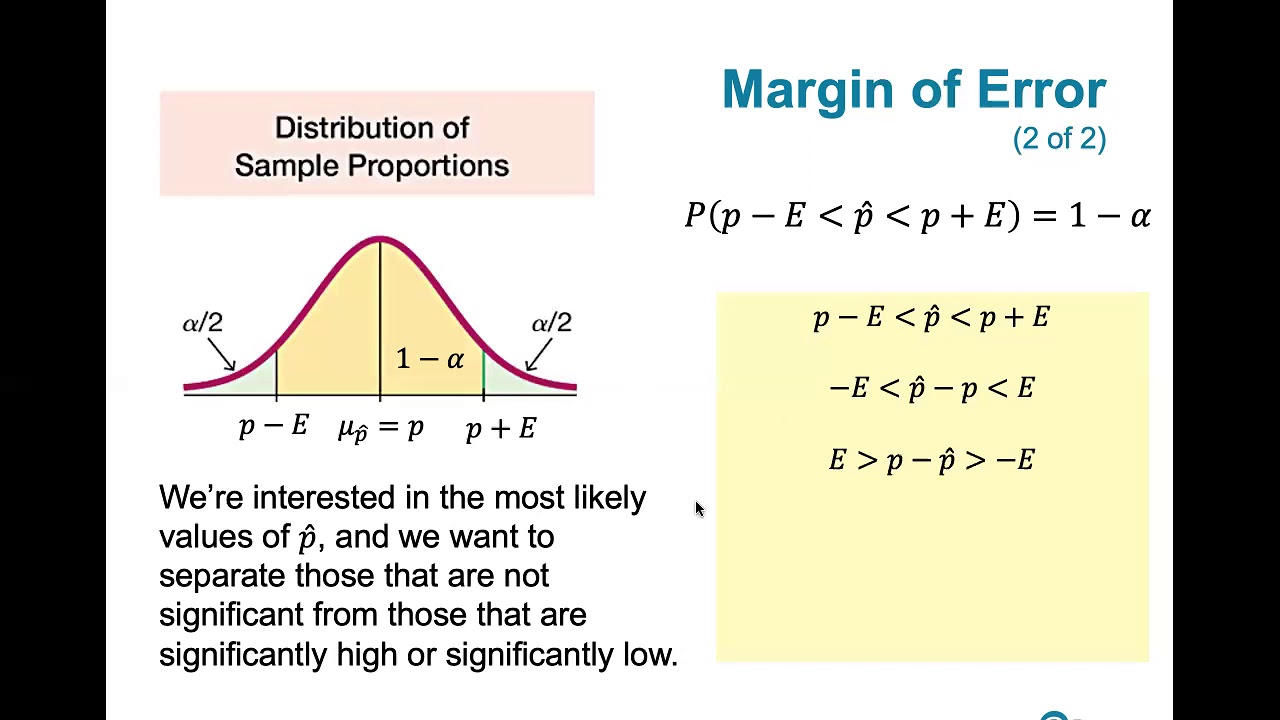
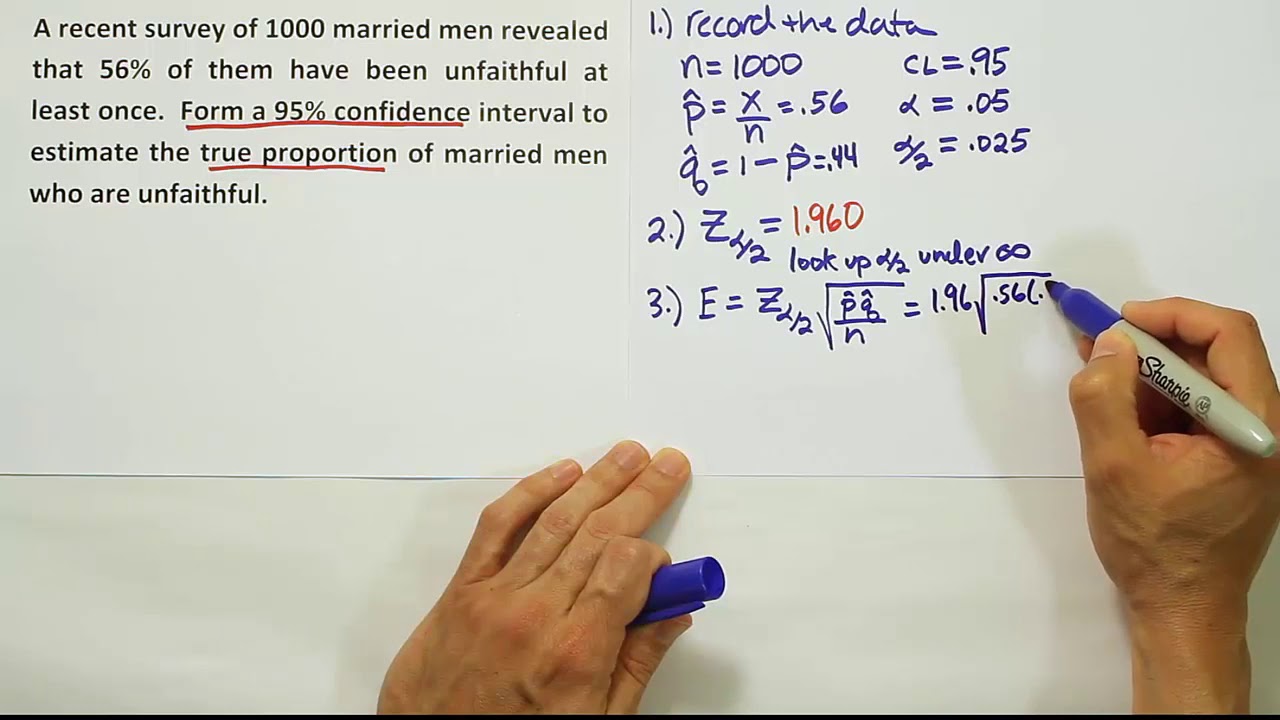
- 📐 The task is to calculate a 99% confidence interval for the proportion of teachers who consider computers as an essential teaching tool.
- 📈 The entire teacher population is considered, with a Bernoulli Distribution where 1 represents teachers who think computers are good and 0 represents those who do not.
- 📊 The sample proportion is calculated as 142 out of 250, which equals 0.568 or 56.8%.
- 📉 The sample variance is computed to be 0.246, and the sample standard deviation is approximately 0.50.
- 📚 The standard deviation of the sampling distribution is estimated to be the sample standard deviation divided by the square root of the sample size, resulting in 0.031.
- 🔍 A 99% confidence interval requires looking at the Z-table to find the value corresponding to 0.995 cumulative probability, which is approximately 2.58 standard deviations away from the mean.
- 📝 The calculated 99% confidence interval for the population proportion is from 0.488 to 0.648, suggesting that between 48.8% and 64.8% of all teachers likely consider computers as essential teaching tools.
- 🔬 To narrow the confidence interval while maintaining a 99% confidence level, the survey could be expanded to include more samples, which would decrease the estimated standard deviation and thus the range of the interval.
Q & A
What is the purpose of the technology grant in the local teaching district?
-The technology grant is available to teachers to install a cluster of four computers in their classrooms.
How many teachers were randomly selected from the district to determine the necessity of computers in classrooms?
-250 teachers were randomly selected from the 6,250 teachers in the district.
How many of the selected teachers felt that computers were an essential teaching tool?
-142 of the selected teachers felt that computers were an essential teaching tool.
What is the task at hand in the script?
-The task is to calculate a 99% confidence interval for the proportion of teachers who believe computers are an essential teaching tool.
What is the sample proportion calculated from the survey?
-The sample proportion is 0.568, which represents 56.8% of the teachers who thought that computers were a good teaching tool.
How is the sample variance calculated in the script?
-The sample variance is calculated by taking the weighted sum of the square differences from the mean and dividing by the total number of samples minus one (249).
What is the estimated sample standard deviation based on the script?
-The estimated sample standard deviation is approximately 0.50.
What is the standard deviation of the sampling distribution in relation to the sample standard deviation?
-The standard deviation of the sampling distribution is the sample standard deviation divided by the square root of the number of samples.
How many standard deviations away from the mean are needed for a 99% confidence interval?
-For a 99% confidence interval, you would be looking at 2.58 standard deviations away from the mean.
What is the calculated 99% confidence interval for the population proportion of teachers who think computers are essential?
-The 99% confidence interval for the population proportion is between 48.8% and 64.8%.
How can the confidence interval be narrowed while maintaining the same confidence level?
-The confidence interval can be narrowed by increasing the sample size, which reduces the estimated standard deviation of the sampling distribution.
Outlines
💻 Technology Grant Survey and Confidence Interval Calculation
The script discusses a scenario where a local teaching district offers a technology grant to install computer clusters in classrooms. Out of 6,250 teachers, 250 were randomly surveyed to gauge the perceived necessity of computers as teaching tools. 142 teachers affirmed their importance. The task is to calculate a 99% confidence interval for the proportion of teachers who consider computers essential. The concept of Bernoulli Distribution is introduced to represent the binary opinions (essential or not essential). The sample proportion (0.568 or 56.8%) and variance (0.246) are calculated from the survey results, setting the groundwork for the confidence interval estimation.
📊 Understanding Sample Variance and Standard Deviation
This paragraph delves into the calculation of the sample variance and standard deviation, which are pivotal for constructing the confidence interval. The sample variance is determined to be 0.246, and taking the square root yields the sample standard deviation of approximately 0.50. The script explains the concept of the sampling distribution of the sample mean and its standard deviation, which is estimated using the sample standard deviation divided by the square root of the sample size, resulting in 0.031 for this scenario.
📚 Calculating the 99% Confidence Interval Using Z-Scores
The script explains the process of calculating the 99% confidence interval by referring to a Z-table. It clarifies that a 99% confidence level corresponds to a Z-score of 2.58, which indicates the number of standard deviations away from the mean that would encompass 99% of the distribution's probability. The Z-table is used to find the exact Z-score that corresponds to 99% cumulative probability, which is found to be 2.58, thus allowing the calculation of the margin of error for the confidence interval.
🔍 Determining the Confidence Interval and Ways to Narrow It
The final paragraph concludes the calculation of the 99% confidence interval by applying the previously determined Z-score to the estimated standard deviation of the sampling distribution. The interval is found to be from 0.488 to 0.648, suggesting that 48.8% to 64.8% of all teachers likely consider computers an essential teaching tool. Additionally, the script addresses how the survey could be modified to narrow the confidence interval while maintaining the same confidence level, suggesting that increasing the sample size would decrease the standard deviation and thus narrow the interval.
Mindmap
Keywords
💡Technology Grant
💡Sample Selection
💡Confidence Interval
💡Population Proportion
💡Bernoulli Distribution
💡Sample Mean
💡Sample Variance
💡Standard Deviation
💡Sampling Distribution
💡Z-table
💡Increasing Sample Size
Highlights
A technology grant is available for teachers to install computers in classrooms.
250 teachers were randomly selected out of 6,250 to determine the necessity of computers in teaching.
142 teachers out of the sample felt computers were essential teaching tools.
A 99% confidence interval is calculated to estimate the proportion of teachers who consider computers essential.
The entire population of teachers is conceptualized with a Bernoulli Distribution where 1 indicates computers as a good tool and 0 indicates otherwise.
The expected value of the distribution, representing the proportion of teachers who think computers are good, is denoted as p.
A sample mean of 0.568, or 56.8%, is calculated from the survey results.
The sample variance is calculated to be 0.246, which is used to estimate the true variance.
The sample standard deviation is estimated to be approximately 0.50.
The standard deviation of the sampling distribution is derived to be 0.031, using the sample standard deviation.
A Z-table is used to determine the number of standard deviations for a 99% confidence interval, which is found to be 2.58.
The 99% confidence interval margin is calculated to be 0.08 from the sample mean.
The 99% confidence interval for the population proportion is estimated to be between 0.488 and 0.648.
The true percentage of teachers who consider computers as a good teaching tool is estimated to be between 48.8% and 64.8%.
To narrow the confidence interval while maintaining a 99% confidence level, more samples should be taken.
Increasing the sample size reduces the standard deviation of the sampling distribution, thus narrowing the confidence interval.
Transcripts
Browse More Related Video

Confidence Interval for a population proportion | Solved Problems
7.1.4 Estimating a Population Proportion - Margin of Error and Computing Confidence Intervals
How to construct a confidence interval for the proportion, an example

Example constructing and interpreting a confidence interval for p | AP Statistics | Khan Academy

Math 14 7.1.13 Find the point estimate, margin of error & confidence interval of pop. proportion p.

Confidence Intervals for Population Proportions
5.0 / 5 (0 votes)
Thanks for rating: