Elementary Stats Lesson #15
TLDRThis video script introduces inferential statistics, focusing on estimating population parameters from sample statistics. It explains the concept of a confidence interval for a population proportion, detailing how to calculate point estimates and margins of error using the sample proportion. The importance of sample size and confidence levels in determining the margin of error is discussed, with examples provided to illustrate the process. The script also covers how to use a calculator for one proportion z-intervals and touches on determining the necessary sample size for a specific margin of error.
Takeaways
- 📚 The instructor is excited to start teaching inferential statistics, a process for generalizing information from a sample to an entire population.
- 🎯 The main goal for the semester is to understand and apply inferential statistics to estimate population parameters based on sample statistics.
- 🔍 Two key areas in inferential statistics are estimation of population parameters and hypothesis testing, with the focus initially on estimation.
- 📈 Parameters are summaries of a population, such as the average, standard deviation, or proportion, which the course aims to estimate using sample statistics.
- 🌐 The process of estimation involves using a sample statistic to make inferences about the corresponding population parameter, such as the population mean (mu) or proportion (p).
- 📝 A point estimate is a single best guess derived from the sample statistic, like the sample proportion, which is the number of successes divided by the sample size.
- 📉 To account for variability, an interval estimate is used, which includes a confidence interval that provides a range of plausible values for the population parameter.
- 🔢 The margin of error is a critical component of the interval estimate, influenced by the confidence level, sample size, and population standard deviation.
- 📉 Confidence levels represent the percentage of times the process is expected to capture the true population parameter, with common levels being 90%, 95%, and 99%.
- ⚖️ The balance between confidence level and margin of error is important; higher confidence requires a larger margin of error, indicating a wider interval.
- 📊 The calculation of the margin of error involves the critical value from the standard normal distribution, which corresponds to the desired confidence level.
Q & A
What is the main goal of inferential statistics discussed in the script?
-The main goal of inferential statistics, as discussed in the script, is to generalize information obtained from a sample to its underlying population, allowing us to estimate population parameters based on sample statistics.
What are the two main areas of inferential statistics covered in the script?
-The two main areas of inferential statistics covered in the script are estimation of the population parameter and hypothesis testing.
What is a parameter in the context of statistics?
-A parameter is a summary measure for a population, such as the average, standard deviation, or proportion, which the script aims to estimate using sample statistics.
What is a point estimate and why is it not sufficient on its own?
-A point estimate is a single value guess, typically the sample proportion, used as the best estimate for a population parameter. However, it is not sufficient on its own because it does not account for the variability inherent in the sampling process, necessitating the use of confidence intervals.
What is a confidence interval and why is it used?
-A confidence interval is an interval of values, calculated from a sample, that is likely to contain the true population parameter. It is used to provide a range of plausible values for the parameter, reflecting the uncertainty due to sampling variability.
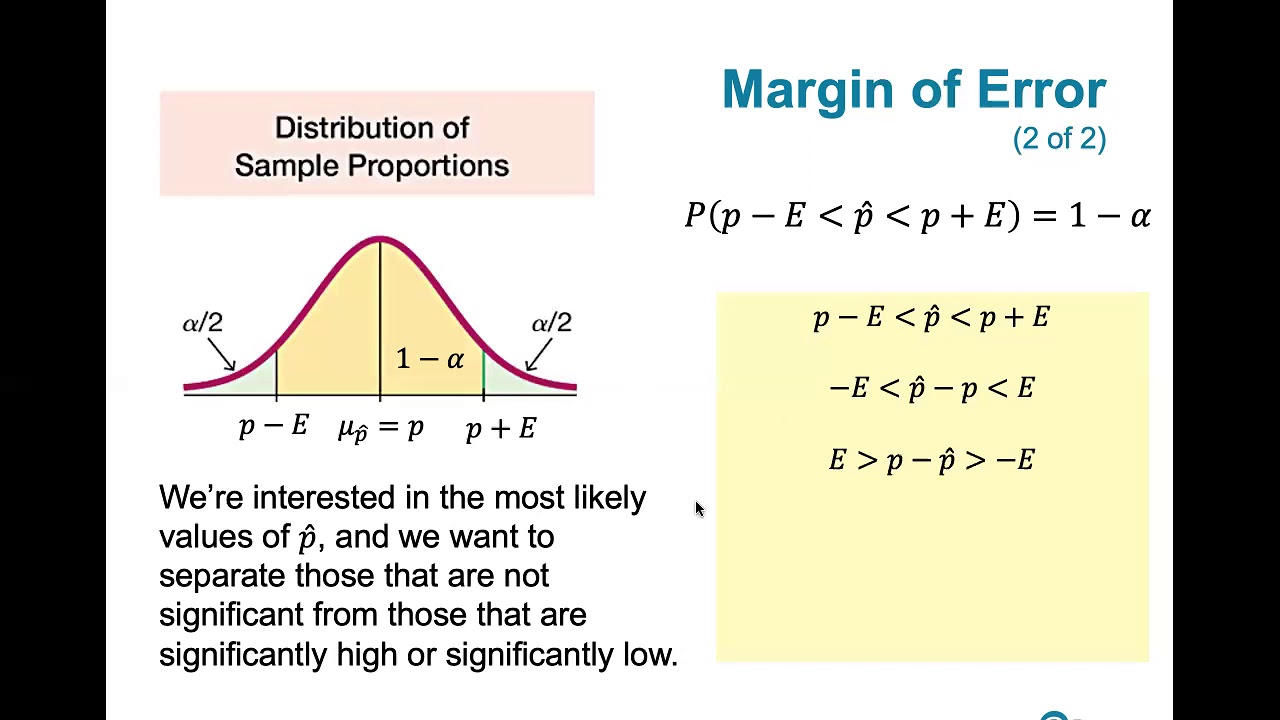
What is the margin of error in a confidence interval and how is it determined?
-The margin of error is the amount added and subtracted from the point estimate to create the confidence interval. It is determined based on several factors, including the confidence level, sample size, and the variability of the sample proportion.
What does the '1.96' value in the script represent and where does it come from?
-The '1.96' value represents the number of standard deviations used for a 95% confidence interval. It comes from the standard normal distribution (z-distribution) and corresponds to the critical value that captures the middle 95% of the distribution.
How does the sample size affect the margin of error in a confidence interval?
-As the sample size increases, the margin of error decreases because the standard error of the sample proportion decreases, leading to a more precise estimate of the population parameter.
What is the formula for calculating the margin of error for a confidence interval of a population proportion?
-The formula for calculating the margin of error is the critical value (z-score) multiplied by the standard error of the sample proportion, which is the square root of (p-hat * (1 - p-hat)) / sample size.
How can you determine the sample size needed for a specific margin of error and confidence level?
-You can determine the required sample size by using the formula n = (Z^2 * p-hat * (1 - p-hat)) / E^2, where Z is the z-score corresponding to the desired confidence level, p-hat is the estimated proportion, and E is the desired margin of error.
What is the purpose of using a calculator to compute confidence intervals and how does it simplify the process?
-A calculator can perform the necessary arithmetic to compute confidence intervals accurately and efficiently, simplifying the process by looking up critical values, performing inverse normal calculations, and reducing the potential for manual calculation errors.
Outlines
📚 Introduction to Inferential Statistics
The instructor begins by expressing excitement about reaching a significant point in the course: the study of inferential statistics. After covering the first eight chapters, the focus shifts to generalizing information from a sample to a larger population. Two main areas of inferential statistics are introduced: estimation of population parameters and hypothesis testing. The lesson specifically starts with parameter estimation, which involves using sample statistics to make inferences about population parameters such as the mean, standard deviation, or proportion. The importance of understanding the behavior of sample statistics is emphasized, especially in the context of estimating population proportions and means.
🎯 Estimating Population Proportion
The video script delves into the process of estimating the population proportion using a sample. A point estimate is first calculated, which in this case is the sample proportion, obtained by dividing the number of successes (e.g., individuals in favor of the death penalty) by the sample size. The script then explains the concept of a confidence interval, which provides a range of plausible values for the population proportion. The margin of error, calculated based on the sample proportion, confidence level, and sample size, is crucial for constructing this interval. The instructor illustrates this with an example from a Quinnipiac University poll, discussing how to calculate the point estimate and the margin of error to estimate the population proportion who favor the death penalty.
🔢 Understanding Margin of Error
The script explains the factors influencing the margin of error in estimating a population proportion. The margin of error is determined by the confidence level, sample size, and the population's inherent variability. The higher the confidence level, the larger the margin of error to ensure a greater likelihood of capturing the true population parameter. Similarly, a larger sample size reduces the margin of error due to decreased standard error. The script also discusses how to calculate the margin of error for the Quinnipiac poll example, emphasizing the role of the sample proportion's standard error and the critical value from the standard normal distribution.
📉 Calculating Confidence Intervals
The script provides a step-by-step guide on calculating confidence intervals for a population proportion. It starts with computing the sample proportion and then uses this to estimate the standard error. The margin of error is determined by multiplying the standard error by a critical value from the standard normal distribution, which corresponds to the desired confidence level. The confidence interval is then constructed by adding and subtracting the margin of error from the point estimate. The script also explains the central limit theorem's role in justifying the use of a normal distribution for sample proportions and how to find critical values for different confidence levels.
🔍 Examining the Central Limit Theorem
The script revisits the central limit theorem, which states that the sampling distribution of the sample proportion is approximately normal with a mean equal to the population proportion. It explains how to use the standard normal table or a calculator to find the critical value for a given confidence level. The 1.96 value, which corresponds to a 95% confidence level, is derived from the theorem and is used to construct the confidence interval. The script emphasizes the importance of the sample size in meeting the normality condition and the independence of sampling.
📝 General Formula for Confidence Intervals
The script presents a general formula for constructing confidence intervals for a population proportion, emphasizing the components involved: the point estimate, standard error estimate, and the critical value. It explains that the point estimate and standard error are derived from the sample, while the critical value is determined by the desired confidence level. The script also provides a 'cheater table' for common confidence levels and their corresponding critical values, including how to obtain these values using a calculator's inverse normal function.
🔢 Using Technology for Confidence Intervals
The script discusses the use of technology, specifically calculators, to simplify the process of constructing confidence intervals. It provides a guide on using a TI-84 calculator to perform a one proportion z interval (one prop z int) calculation. The process involves entering the number of successes, sample size, and confidence level into the calculator, which then computes the confidence interval. The script illustrates this with examples, showing how the calculator can efficiently handle the arithmetic and lookup of critical values.
📉 Determining Sample Size for a Specific Margin of Error
The script addresses the problem of determining the necessary sample size to achieve a specific margin of error when estimating a population proportion. It presents a formula for calculating the required sample size based on the desired margin of error, the confidence level, and an estimate of the population proportion. The script explains two methods for handling the absence of a prior estimate for the population proportion: using an estimate from a previous study or employing a conservative approach by assuming a proportion of 0.50, which maximizes the required sample size.
🎓 Conclusion and Future Lessons
The instructor concludes the lesson by summarizing the importance of the confidence interval as a tool for estimating population proportions and the significance of the sample size in achieving a desired margin of error. The script hints at future lessons that will cover the estimation of population means and other aspects of statistical inference, encouraging students to look forward to becoming proficient in these areas.
Mindmap
Keywords
💡Inferential Statistics
💡Parameter
💡Estimation
💡Sample Proportion
💡Confidence Interval
💡Margin of Error
💡Level of Confidence
💡Point Estimate
💡Standard Error
💡Critical Value
💡Sample Size
Highlights
Introduction to inferential statistics as a method for generalizing information from a sample to an entire population.
Two main areas of inferential statistics: estimation of population parameters and hypothesis testing.
Emphasis on estimating the value of a population parameter using sample statistics.
Explanation of parameters as summaries for a population, such as the average, standard deviation, or proportion.
The importance of using sample statistics to make inferences about population parameters.
Introduction of a point estimate as the best single value guess derived from the sample.
Discussion on the variability of the sample proportion and its impact on the margin of error.
The concept of confidence intervals as a range of plausible values for an unknown population parameter.
How the level of confidence is determined and its relation to the margin of error.
The role of sample size in affecting the margin of error and the precision of the estimate.
Calculation of the margin of error using the sample proportion, standard error, and critical value.
Example of estimating the population proportion using a Quinnipiac University poll about the death penalty.
Explanation of the standard error estimate and its calculation based on the sample proportion.
Use of the central limit theorem to justify the normal approximation of the sampling distribution of the sample proportion.
Construction of a 95% confidence interval for the population proportion and interpretation of the results.
General formula for constructing confidence intervals for a population proportion and its components.
Different methods for determining the sample size necessary to achieve a specific margin of error.
The impact of the desired confidence level on the required sample size for a given margin of error.
Practical application of determining sample size using an example from a sociologist estimating the percentage of English-speaking Americans.
Transcripts
Browse More Related Video

7.1.6 Estimating a Pop. Proportion - The Right Sample Size for a Given Error and Confidence Level

Confidence Interval for a population proportion | Solved Problems
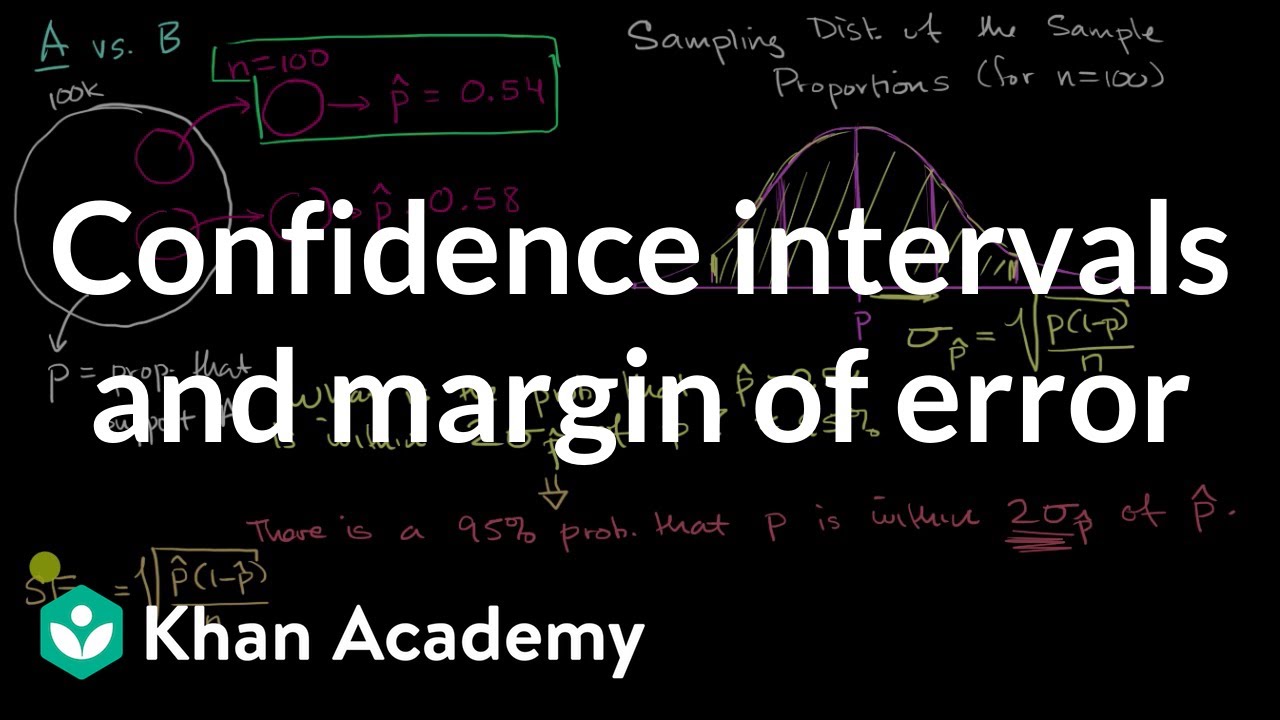
Confidence intervals and margin of error | AP Statistics | Khan Academy
7.1.4 Estimating a Population Proportion - Margin of Error and Computing Confidence Intervals
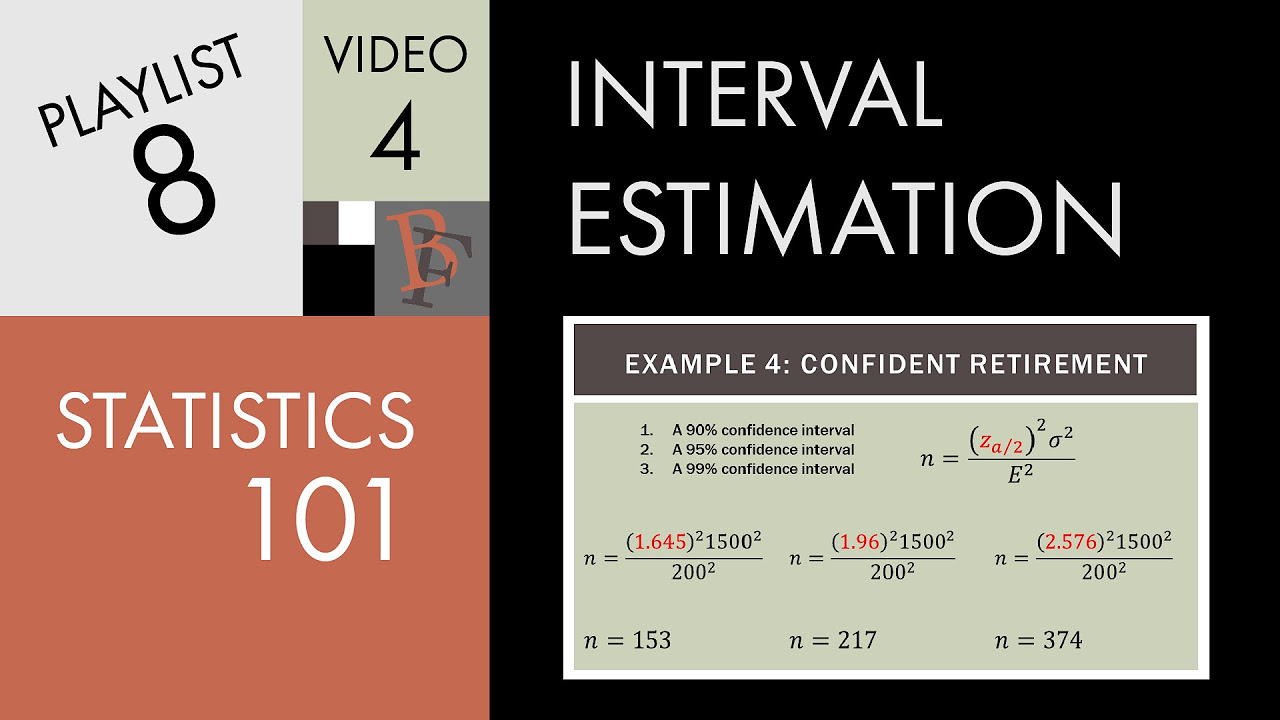
Statistics 101: Confidence Intervals, Estimating Sample Size Needed
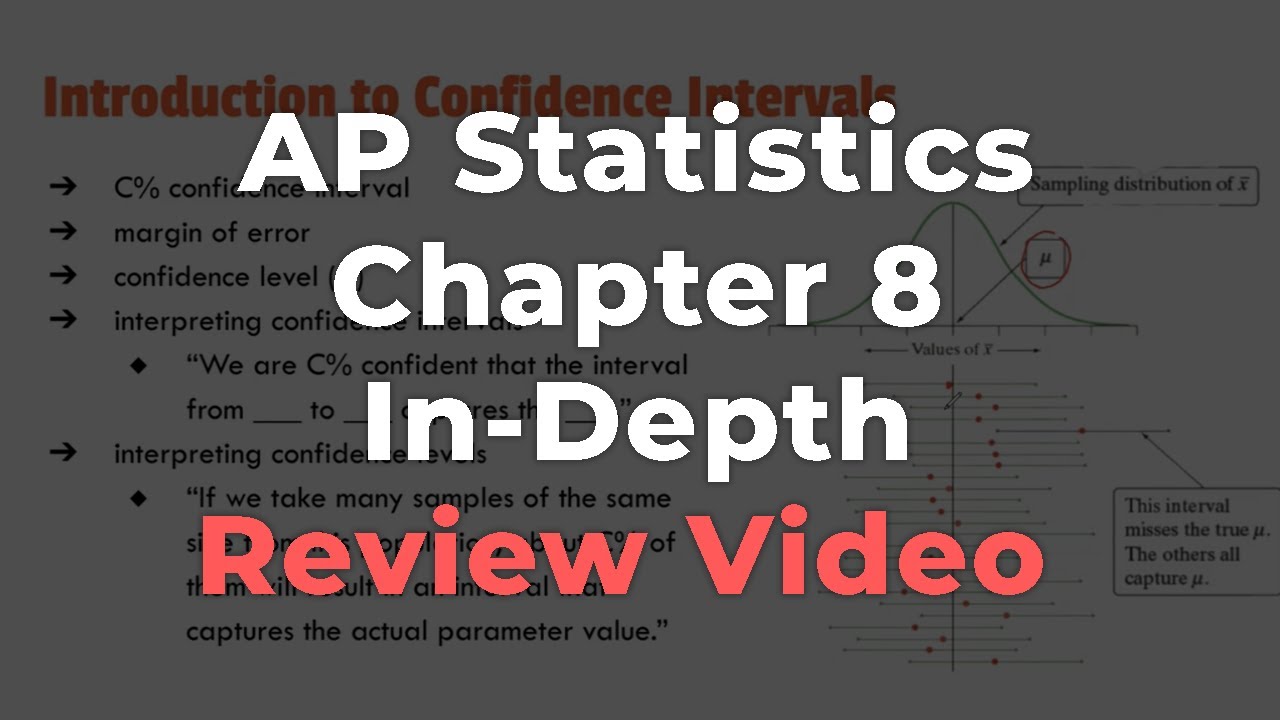
AP Statistics Chapter 8 In-Depth Review Video
5.0 / 5 (0 votes)
Thanks for rating: