Confidence Interval for a population proportion | Solved Problems
TLDRThis video script explains the process of estimating a population proportion using confidence intervals. It begins by defining a point estimate as the sample proportion, denoted as p-hat, calculated by the formula x/n, where x is the number of successes and n is the sample size. The script uses an example where 420 out of 500 adults responded 'yes' to a question, resulting in a sample proportion of 0.84. This value serves as an estimate for the population proportion but does not guarantee that exactly 84% of the population will respond 'yes'. To make inferences about the population, a confidence interval is constructed, which is a range of values expected to capture the population parameter at a given confidence level. The confidence interval is calculated using the sample proportion plus or minus the margin of error, which is determined by the z-critical value and the standard error of the sample proportion. The standard error represents the estimated standard deviation of the distribution of sample proportions. The script illustrates how to calculate the standard error, determine the z-critical value based on the desired confidence level, and construct confidence intervals at various levels (85%, 94%, and 97%). It emphasizes the importance of not rounding intermediate calculations and explains that the width of the confidence interval is influenced by the confidence level and the sample size. Larger sample sizes lead to more precise estimations and narrower confidence intervals. The video concludes by noting that while a confidence interval provides an estimated range for the population proportion, it does not confirm the inclusion of the true population proportion within that range.
Takeaways
- 📊 Point Estimate: The single value estimate of the unknown population proportion is the sample proportion (p-hat), calculated as x/n where x is the number of successes and n is the sample size.
- ✅ Sample Proportion: If 420 out of 500 adults responded 'yes', the sample proportion is 0.84, which serves as an estimate for the population proportion.
- 🔍 Confidence Interval: A range of values that is expected to capture the population parameter at a certain confidence level, which does not guarantee that exactly 84% of the population will respond 'yes'.
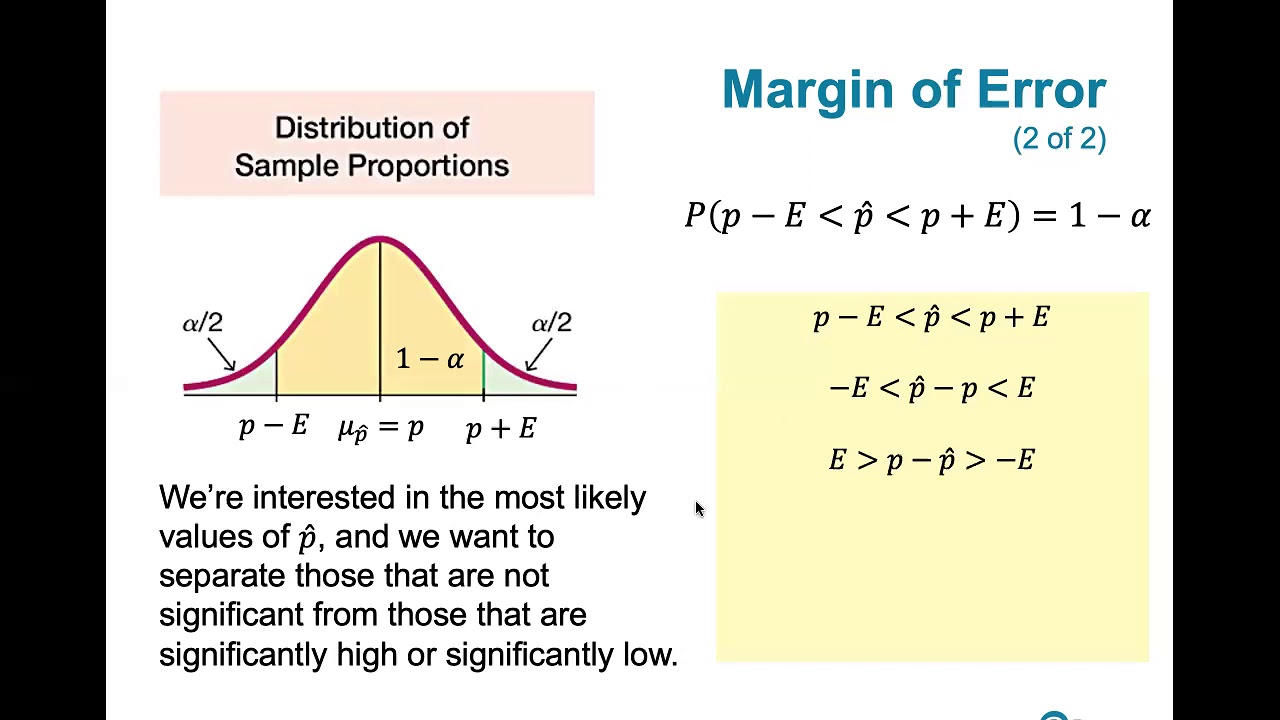
- 🧮 Formula for Confidence Interval: Calculated as the sample proportion plus or minus the margin of error, which is the z-critical value times the standard error of the sample proportion.
- 📉 Standard Error: Represents the estimated standard deviation of the distribution of sample proportions, indicating how much we expect a sample proportion to differ from the true population proportion.
- ⚖️ Margin of Error: A critical component in constructing the confidence interval, determined by multiplying the z-critical value with the standard error.
- 🔢 Z-Critical Value: Determined based on the required confidence level and is used to calculate the margin of error.
- 📉 Significance Level: Represents the probability (1 - confidence level) that the true population parameter does not fall within the calculated confidence interval.
- 🔢 Tail Area: The area in the tails of the distribution outside the confidence interval, which is used to find the z-critical value.
- 📌 Constructing Intervals: For different confidence levels (85%, 94%, 97%), the z-critical value, margin of error, and the resulting confidence interval limits are calculated.
- 🔄 Interpretation: A confidence interval indicates that if the same process is repeated many times, in the long run, about the given percentage of those intervals will contain the true population proportion.
- 🔄 Width of Interval: The confidence level and sample size both affect the width of the confidence interval, with higher confidence levels and larger sample sizes producing wider intervals and more precise estimations.
Q & A
What is a point estimate in the context of population proportion?
-A point estimate is a single value estimate for the unknown population proportion, represented by the sample proportion p-hat, which is calculated as x/n, where x is the number of successes and n is the sample size.
What is the sample proportion of failures denoted as?
-The sample proportion of failures is denoted as q-hat, which is calculated as 1 - p-hat.
How is the sample proportion calculated in the provided example with 500 adults and 420 responding 'yes'?
-The sample proportion is calculated as 420/500, which equals 0.84.
What is the purpose of constructing a confidence interval for the population proportion?
-The purpose of constructing a confidence interval is to provide a range of values that we expect to capture the population parameter p at a certain confidence level, which helps in inferring or generalizing about the population.
How is the margin of error for a confidence interval calculated?
-The margin of error is calculated as the z-critical value times the standard error of the sample proportion.
What is the standard error of the sample proportion?
-The standard error is the estimated standard deviation of the distribution of sample proportions, which is an estimation of how much we expect a sample proportion to differ from the true population proportion.
What is the minimum required number of successes and failures for a confidence interval to be valid?
-The confidence interval is valid when the sample size is large enough to ensure a minimum of 5 or more successes and failures, depending on the discipline.
What is the significance level in the context of confidence intervals?
-The significance level, represented by alpha, is the area in the tails of the distribution that is not included in the confidence interval. It is calculated as 1 minus the confidence level.
How does the confidence level affect the width of the confidence interval?
-As the confidence level increases, the z-critical value increases, which in turn increases the margin of error and makes the confidence interval wider. Conversely, a lower confidence level results in a narrower confidence interval.
How does the sample size affect the width of the confidence interval?
-The sample size affects the width of the confidence interval through its presence in the denominator of the standard error formula. A larger sample size decreases the standard error, which decreases the margin of error and narrows the confidence interval.
What is the interpretation of an 85% confidence interval for the population proportion?
-An 85% confidence interval means that if we were to construct 85% confidence intervals for many random samples from the population, we would expect about 85% of those intervals to contain the true population proportion, and about 15% not to contain it.
How does the sample size of 500 compare to a sample size of 200 or 100 in terms of the confidence interval width?
-A sample size of 500 will produce a narrower confidence interval than a sample size of 200, and an even narrower interval than a sample size of 100, assuming the same confidence level, because a larger sample size generally leads to a more precise estimation.
Outlines
📊 Estimating Population Proportion with Confidence Intervals
This paragraph introduces the concept of estimating a population proportion using confidence intervals. It explains that a point estimate is a single value estimate for the unknown population proportion, represented by the sample proportion p-hat, which is calculated as the number of successes (x) divided by the sample size (n). The sample proportion of failures is denoted as q-hat. Using a sample of 500 adults where 420 responded 'yes' to a question, the sample proportion is calculated as 0.84. This value serves as an estimate for the population proportion but does not guarantee that exactly 84% of the population will respond 'yes'. To make inferences about the population, a confidence interval is constructed, which is a range of values expected to capture the population parameter (p) at a given confidence level. The confidence level indicates the proportion of times the interval is expected to capture the population parameter with repeated sampling. The confidence interval for p is calculated using the formula: sample proportion ± (z-critical value * standard error of the sample proportion). The standard error is an estimate of the standard deviation of the distribution of sample proportions, representing how much we expect a sample proportion to differ from the true population proportion on average. The confidence interval is valid when the sample size is large enough to meet the minimum required number of successes and failures, which is typically 5 or more. The z-critical value is determined based on the desired confidence level, with common confidence intervals constructed at the 95% level unless stated otherwise. The video demonstrates constructing confidence intervals at unconventional levels, such as 85% and 94%, and explains the process of calculating the standard error, finding the z-critical value, and determining the margin of error to establish the confidence interval's limits. It concludes by interpreting the confidence interval and explaining that if multiple such intervals were constructed from random samples of the population, about 85% of them would be expected to contain the true population proportion in the long run.
🔍 Confidence Intervals: Impact of Confidence Level and Sample Size
This paragraph discusses the impact of the confidence level and sample size on the width of a confidence interval. It explains that as the confidence level increases, the z-critical value also increases, leading to a larger margin of error and consequently a wider confidence interval. Conversely, a lower confidence level results in a narrower interval. The sample size is another factor that affects the width of the confidence interval. Since the sample size is in the denominator of the standard error formula, increasing the sample size decreases the standard error, which in turn reduces the margin of error and narrows the confidence interval. This aligns with the logic that larger samples are expected to yield more precise estimates. The video provides an example to illustrate this point, stating that a sample size of 200 would produce a wider confidence interval than a sample size of 500, but a narrower one than a sample size of 100. The paragraph concludes by summarizing the key takeaways from the video and thanking the viewer for watching.
Mindmap
Keywords
💡Point Estimate
💡Sample Proportion
💡Confidence Interval
💡Margin of Error
💡Standard Error
💡Z-Critical Value
💡Confidence Level
💡Significance Level
💡Sample Size
💡Successes and Failures
💡Population Proportion
Highlights
Estimating a population proportion involves constructing confidence intervals.
A point estimate for the unknown population proportion is the sample proportion p-hat, calculated as x/n where x is the number of successes and n is the sample size.
The sample proportion of failures is denoted as q-hat and is equal to 1 – p-hat.
For a sample of 500 adults, with 420 responding 'yes', the sample proportion is 0.84, serving as a point estimate for the population proportion.
A point estimate alone does not guarantee that the same percentage of the population will respond 'yes'.
Confidence intervals provide a range of values that are expected to capture the population parameter at a given confidence level.
The confidence level indicates the proportion of times the population parameter is expected to be captured with repeated sampling.
The confidence interval for a population proportion (p) is computed as the sample proportion plus or minus the margin of error.
The margin of error is calculated using the z-critical value times the standard error of the sample proportion.
The standard error estimates the standard deviation of the distribution of sample proportions, reflecting how much the sample proportion may differ from the true population proportion.
The confidence interval is valid when the sample size is large enough to ensure at least 5 successes and failures.
The z-critical value is determined based on the required confidence level, with common values provided for reference.
Most reported confidence intervals are constructed at the 95% confidence level unless stated otherwise.
For unconventional confidence levels, the formula for the confidence interval remains the same but uses different z-critical values.
The standard error for the given example is calculated to be 0.0164, which should not be rounded in intermediate steps.
The significance level (alpha) is determined by subtracting the confidence level from 1 and is used to find the critical z-value.
The critical z-value for an 85% confidence interval is 1.44, resulting in a margin of error of 0.0236 and a confidence interval from 0.816 to 0.864.
Constructing confidence intervals implies that in the long run, about 85% of such intervals will contain the true population proportion.
Increasing the confidence level results in a wider confidence interval due to an increased z-critical value and margin of error.
The sample size also affects the width of the confidence interval, with larger sample sizes producing more precise estimates.
A larger sample size reduces the standard error, margin of error, and consequently the width of the confidence interval.
The video concludes by emphasizing that larger sample sizes lead to more precise estimations, as demonstrated by the comparison between sample sizes of 100, 200, and 500.
Transcripts
Browse More Related Video

Confidence interval example | Inferential statistics | Probability and Statistics | Khan Academy
7.1.4 Estimating a Population Proportion - Margin of Error and Computing Confidence Intervals

Elementary Stats Lesson #15
Confidence intervals and margin of error | AP Statistics | Khan Academy

Example constructing and interpreting a confidence interval for p | AP Statistics | Khan Academy

Confidence Intervals for Population Proportions
5.0 / 5 (0 votes)
Thanks for rating: