Statistics 101: Confidence Intervals, Estimating Sample Size Needed
TLDRThis educational video delves into the concept of estimating sample size in statistics, focusing on the relationship between confidence intervals, margin of error, and sample size. The host provides a step-by-step guide on how to calculate the necessary sample size given a specific margin of error and confidence level, using the formula involving the z-score, population standard deviation, and desired margin of error. The video also discusses methods to estimate the population standard deviation when it's unknown, and illustrates the process with various real-world examples, emphasizing the importance of understanding these statistical principles for hypothesis testing.
Takeaways
- 😀 Stay positive and persistent when facing challenges in statistics, as hard work and patience can help overcome difficulties.
- 📢 Follow the presenter on YouTube, Twitter, or LinkedIn to stay updated on new videos and engage with the content.
- 👍 Encourage the creation of more videos by liking, sharing, and adding them to playlists, or provide constructive feedback for improvement.
- 📚 The video series is designed for beginners in statistics, focusing on basic concepts delivered in a slow and deliberate manner.
- 🔄 The video discusses a method to calculate the necessary sample size given a margin of error, which is a reversal of the usual process.
- 📉 The margin of error is influenced by the sample size, with larger samples generally leading to smaller margins of error and more representative results.
- ⚖️ The formula for calculating sample size involves rearranging the margin of error formula to solve for the sample size (n).
- 📈 The population standard deviation (σ) is crucial for sample size calculation, and when unknown, an estimate or planning value must be used.
- 🛒 Options for estimating σ include using data from previous studies, conducting a pilot study, or making an educated guess based on the data's range.
- 📊 The video provides several examples illustrating how to calculate sample size for different confidence levels and margins of error.
- 🔑 Understanding the relationship between sample size, confidence level, and margin of error is fundamental to grasping statistical concepts and hypothesis testing.
Q & A
What is the main topic of the video series?
-The main topic of the video series is basic statistics, focusing on concepts such as confidence intervals, point estimation, and sample size calculations.
What encouragement does the speaker provide to viewers who might be struggling with their statistics class?
-The speaker encourages viewers to stay positive, keep their heads up, and recognize that they have already accomplished a lot. They emphasize that with hard work, practice, and patience, viewers can overcome their current challenges.
How should viewers interact with the speaker's content on social media platforms?
-Viewers are encouraged to follow the speaker on YouTube, Twitter, and LinkedIn to stay updated with new video uploads. They can also show support by liking, sharing, and adding videos to playlists.
What is the purpose of leaving constructive comments on the video?
-Leaving constructive comments allows the speaker to take the feedback into account when creating new content, thereby improving the quality and relevance of future videos.
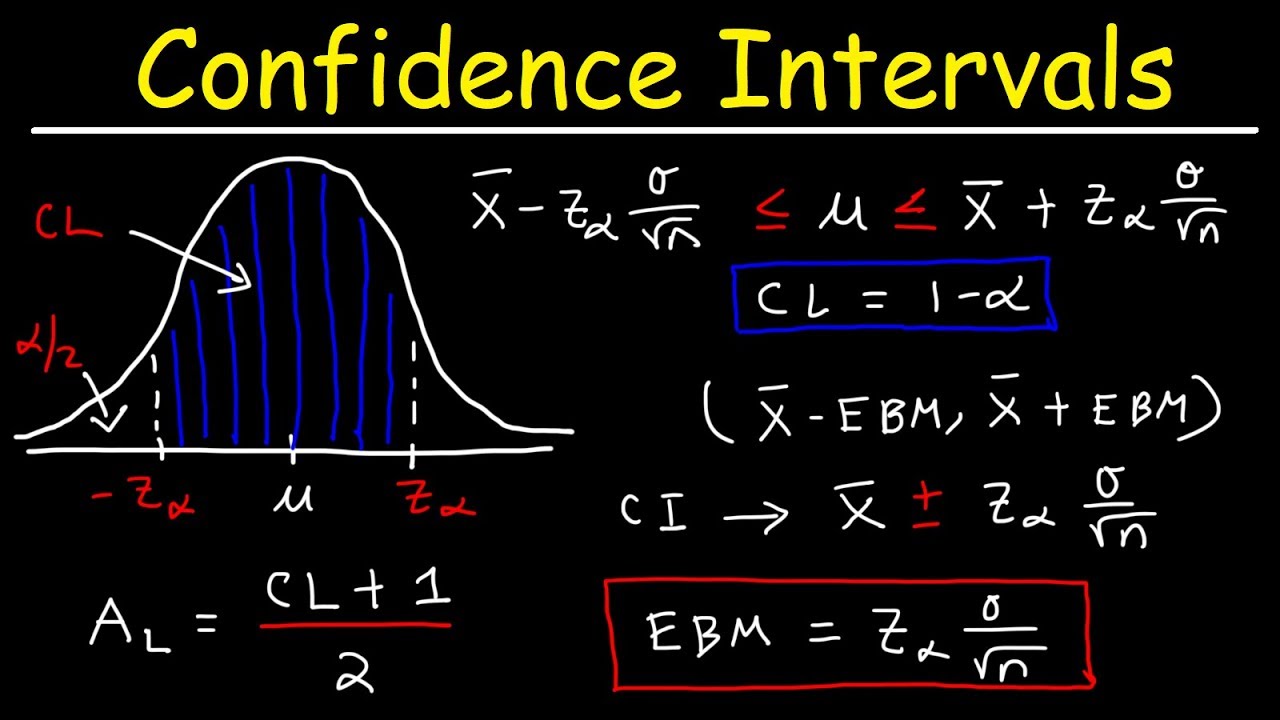
What is the general formula for calculating the margin of error in statistics?
-The general formula for the margin of error is the sample mean plus or minus (z * (σ / √n)), where z is the z-score corresponding to the desired confidence level, σ is the population standard deviation, and n is the sample size.
How does the speaker plan to rearrange the margin of error formula in this video?
-The speaker plans to rearrange the margin of error formula to solve for the sample size (n), given a specific margin of error, confidence level, and population standard deviation.
What are some methods to estimate the population standard deviation (σ) when it is unknown?
-Methods to estimate σ include using an estimate from previous studies, conducting a pilot study to determine the sample standard deviation, or using a judgment or best guess, such as the range of the data divided by four.
How does the sample size affect the margin of error in a statistical estimation?
-As the sample size increases, the margin of error decreases, making the sample more representative of the population and reducing the standard error.
What is the relationship between the confidence level, margin of error, and sample size?
-A higher confidence level or a smaller margin of error requires a larger sample size. This is because larger samples are more representative of the population and can provide more precise estimates.
Can you provide an example of how to calculate the sample size needed for a given margin of error and confidence level?
-Yes, using the rearranged margin of error formula, n = (Z^2 * σ^2) / E^2, where Z is the z-score for the desired confidence level, σ is the population standard deviation, and E is the margin of error, you can calculate the required sample size.
What is the significance of understanding the relationship between sample size, margin of error, and confidence level in statistics?
-Understanding this relationship is crucial for designing effective studies and experiments. It helps researchers determine the appropriate sample size to achieve a desired level of precision and confidence in their results.
Outlines
📚 Introduction to Basic Statistics
The video begins with an introduction to the basic statistics series, addressing viewers who might be struggling with a class and encouraging them to stay positive. The speaker emphasizes that watching the video indicates prior accomplishment and intelligence. They invite viewers to follow on social media for updates and request feedback for improvement. The video's aim is to cover fundamental statistical concepts in a slow and deliberate manner, ensuring understanding of not just 'what' but also 'why' and 'how' to apply them. The session will revisit confidence intervals and point estimation, but with a twist, focusing on calculating sample size from a given margin of error.
🔍 Understanding Margin of Error and Sample Size
This paragraph delves into the concept of margin of error in estimating population parameters using sample statistics. It explains the standard error of the mean and how it's influenced by sample size. The speaker introduces the formula for margin of error, emphasizing the components involved: the Z-score for the desired confidence level, the population standard deviation, and the square root of the sample size. The main objective is to rearrange this formula to solve for the necessary sample size, given a specific margin of error. The paragraph also discusses different methods to estimate the population standard deviation when it's unknown, such as using previous studies, conducting a pilot study, or making an educated guess based on the data's range.
📉 Demonstrating Sample Size Calculation
The speaker provides an abstract example to demonstrate how to calculate the required sample size for a given margin of error and confidence level. Using a hypothetical scenario where the population standard deviation is known, the formula for sample size is applied to determine how many samples are needed to achieve a 95% confidence interval with a margin of error of eight. The process involves substituting values into the rearranged margin of error formula and solving for the sample size, which is found to be 708 in this case. The explanation is designed to help viewers understand the relationship between sample size, margin of error, and confidence level.
🛒 Real-World Application: Gas Prices and Sample Size
The script presents a real-world example involving the average price of gasoline, using data from the Chicago Tribune. With a known sample standard deviation of 5 cents, the speaker calculates the sample size needed to estimate the average price within different margins of error at a 95% confidence level. The results show that a smaller margin of error requires a larger sample size, illustrating the trade-off between precision and the amount of data needed. For margins of error of 5 cents, 3 cents, and 1 cent, the required sample sizes are 44, 111, and 977 gas stations, respectively.
🏭 Auto Production and Sample Size Estimation
The script moves on to another real-world scenario involving a global auto company's production data. Without a known standard deviation, the speaker uses the range of production data divided by four as an estimate for the population standard deviation. The goal is to determine the sample size of production hours needed to estimate vehicle production with a 95% confidence interval and various margins of error. The calculations show that to achieve margins of error of 100, 50, and 30 cars, sample sizes of 7, 26, and 73 random hours are required, respectively.
💼 Retirement Investment Survey and Confidence Intervals
The final example provided is a fictional survey by the US Chamber of Commerce regarding upper-level managers' retirement investment practices. Given a planning value for the standard deviation of $1,500 and a desired margin of error of $200, the speaker calculates the sample size needed for different confidence intervals: 90%, 95%, and 99%. The calculations reveal that as the confidence level increases, the required sample size also increases, being 1,153 for 90%, 2,117 for 95%, and 3,749 for 99% confidence intervals.
🔚 Conclusion and Future Outlook
In conclusion, the speaker emphasizes the importance of understanding the relationship between sample size, margin of error, and confidence level. They highlight that a firm grasp of these concepts is crucial for future topics such as hypothesis testing. The speaker also reminds viewers to stay positive, engage with the content, and provide feedback for improvement. The video ends with an encouragement to continue learning and improving, setting the stage for upcoming videos on hypothesis testing.
Mindmap
Keywords
💡Statistics
💡Confidence Intervals
💡Margin of Error
💡Sample Size
💡Population Standard Deviation (Sigma)
💡Point Estimation
💡Z-Score
💡Algebraic Manipulation
💡Pilot Study
💡Constructive Comment
Highlights
Encouragement for viewers struggling in class to stay positive and believe in their capabilities.
Invitation to follow the channel on YouTube, Twitter, and LinkedIn for updates on new videos.
Request for feedback through likes, shares, and constructive comments to improve video content.
Introduction of the video's focus on calculating sample size from a given margin of error in statistics.
Explanation of rearranging the margin of error formula to solve for sample size.
Review of the margin of error formula and its components.
Illustration of the process to algebraically solve for sample size using the margin of error formula.
Discussion on estimating the population standard deviation (Sigma) when it's unknown.
Presentation of an abstract example to calculate the sample size for a 95% confidence interval with a margin of error of eight.
Real-world application of determining sample size for estimating average gasoline prices with different confidence levels.
Analysis of car production data to determine sample size for hourly production estimates with varying confidence intervals.
Explanation of how to calculate sample size for retirement investment practices survey with different confidence levels.
Graphical representation of the relationship between sample size, margin of error, and confidence interval.
Clarification on how changes in confidence level and margin of error affect the required sample size.
Summary of the importance of understanding the relationship between sample size, confidence interval, and margin of error in statistics.
Connection between understanding sample size calculations and preparing for hypothesis testing in statistics.
Final encouragement for viewers to maintain a positive attitude towards learning and improvement.
Transcripts
Browse More Related Video
How To Find The Z Score, Confidence Interval, and Margin of Error for a Population Mean
7.2.4 Estimating a Population Mean - Sample Size for a Desired Margin of Error and Confidence Level
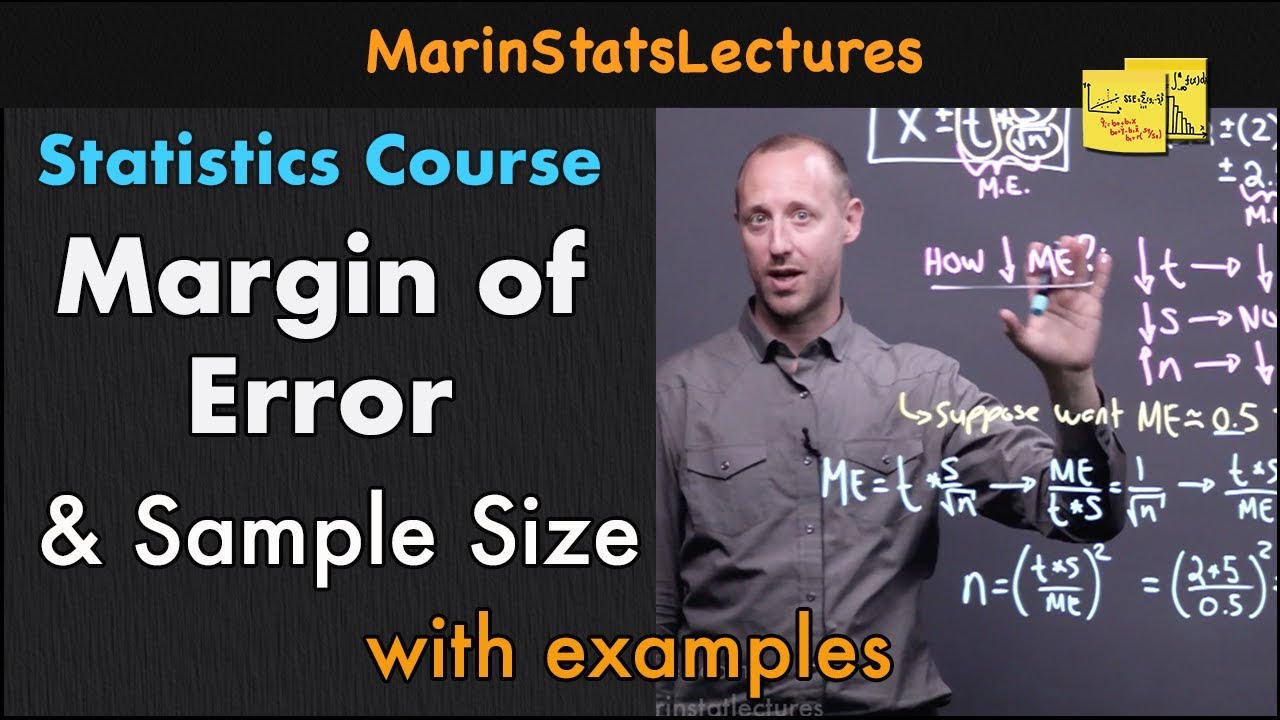
Margin of Error & Sample Size for Confidence Interval | Statistics Tutorial #11| MarinStatsLectures

Elementary Stats Lesson #16

Elementary Stats Lesson #15

Confidence Interval for a population proportion | Solved Problems
5.0 / 5 (0 votes)
Thanks for rating: