AP Statistics Unit 8 Chi Square Tests Summary Review Video
TLDRThis review video on AP Statistics Unit 8 delves into Chi-Square tests for categorical data, essential for analyzing statistical distributions. It outlines three Chi-Square tests: Goodness of Fit, Independence, and Homogeneity, each serving unique purposes in statistics. The video simplifies identifying the appropriate test and executing it through detailed steps, including hypothesis setup, condition checking, Chi-Square calculation, and concluding with statistical significance. Useful for students seeking to understand and apply these concepts effectively, the tutorial encourages the use of an accompanying study guide to reinforce learning and practice.
Takeaways
- 📚 Unit 8 in AP Statistics focuses on the Chi-Square test for categorical data, which is used to analyze counts from different categories.
- 📊 There are three types of Chi-Square tests: goodness of fit, test for independence (association), and test for homogeneity, each with a specific application.
- 🧐 The Chi-Square test involves four main steps: stating the test and hypotheses, checking conditions and calculating expected values, calculating the Chi-Square statistic and P-value, and making a conclusion.
- ✅ The null hypothesis typically states that observed frequencies match expected frequencies or that there is no association between variables, while the alternative hypothesis suggests the opposite.
- 🔢 Expected values for each category in a Chi-Square test are calculated based on the total sample size and the theoretical distribution.
- 📉 The Chi-Square statistic is computed by taking the difference between observed and expected values, squaring it, and dividing by the expected value for each category.
- 📈 Degrees of freedom for a Chi-Square test are calculated based on the number of categories minus one for goodness of fit, or the product of the number of categories minus one for each variable in tests for independence and homogeneity.
- 🤔 A low P-value (less than the significance level, often 0.05) indicates evidence to reject the null hypothesis in favor of the alternative, suggesting a significant result.
- 📈 The Chi-Square test for independence examines if two categorical variables are associated, while the test for homogeneity determines if the distribution of a categorical variable is the same across different populations.
- 📝 Conducting a Chi-Square test requires checking that the sample is random, the sample size is less than 10% of the population, and there are five or more expected counts in each category.
- 📚 It is essential to use the correct Chi-Square test based on the research question, whether it involves one categorical variable (goodness of fit) or two (independence or homogeneity).
Q & A
What is the purpose of a Chi-Square test in statistics?
-A Chi-Square test in statistics is used to determine whether there's a significant association between categorical variables. It tests whether distributions of categorical variables differ from each other or from an expected distribution.
Can you describe the three types of Chi-Square tests mentioned in the video?
-The three types of Chi-Square tests are: 1) Goodness of Fit, which tests if observed categorical data matches an expected distribution for one variable; 2) Test for Independence (or Association), which checks if there's a significant association between two categorical variables in a contingency table; 3) Test for Homogeneity, which compares the distribution of categories across different populations or groups.
What are the steps involved in conducting a Chi-Square Test for Goodness of Fit?
-The steps for conducting a Chi-Square Test for Goodness of Fit include: 1) Naming the test and writing the hypotheses; 2) Checking the conditions and calculating the expected values; 3) Calculating the total Chi-Square value and the P-value; 4) Making a conclusion based on the comparison of the P-value to the significance level.
How do you calculate the expected counts in a Chi-Square Test for Independence?
-In a Chi-Square Test for Independence, expected counts for each cell in a contingency table are calculated by taking the product of the row total and the column total for that cell, then dividing by the grand total of all observations.
What does it mean to 'fail to reject the null hypothesis' in the context of a Chi-Square test?
-Failing to reject the null hypothesis in a Chi-Square test means that there is not enough statistical evidence to suggest that the observed distribution is significantly different from the expected distribution, based on the significance level set for the test.
What is the significance of the degrees of freedom in a Chi-Square test?
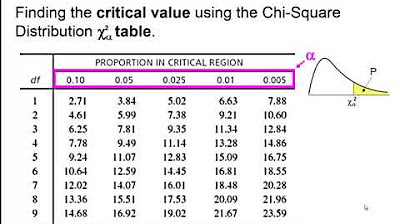
-Degrees of freedom in a Chi-Square test relate to the number of categories minus one. They are used to determine the critical value from the Chi-Square distribution, which is necessary to calculate the P-value and make decisions about the null hypothesis.
How is a Chi-Square Test for Homogeneity different from a Test for Independence?
-While both tests involve contingency tables, the Test for Homogeneity compares distributions of a categorical variable across different populations or groups, assuming they are from the same population. The Test for Independence assesses if there is a significant relationship between two categorical variables within one population.
What are the conditions that must be met before performing any Chi-Square test?
-Conditions for performing a Chi-Square test include: 1) Data must be collected randomly to avoid bias; 2) Sample size must be less than 10% of the population for independence assumptions; 3) Each category must have an expected count of five or more to meet validity requirements for the test.
How do you interpret a P-value in the context of a Chi-Square test?
-In a Chi-Square test, the P-value represents the probability of observing a test statistic as extreme as, or more extreme than, the value calculated from the data, assuming the null hypothesis is true. A small P-value (typically less than 0.05) leads to rejecting the null hypothesis, indicating significant association or difference.
Why is it important to ensure that the sample is less than 10% of the population in a Chi-Square test?
-Ensuring the sample is less than 10% of the population in a Chi-Square test is important to validate the assumption of independence among the observations. This condition helps to minimize the impact of potential correlations within the data due to sampling from a limited population.
Outlines
📊 Introduction to Chi-Square Tests for Categorical Data
This paragraph introduces the topic of Chi-Square tests, which are statistical methods used to analyze categorical data. It emphasizes that the video serves as a review, covering the main points of Chi-Square tests, including goodness of fit, test for independence, and test for homogeneity. The presenter also encourages viewers to use the accompanying study guide and review packet for a deeper understanding and practice.
👁️ Eye Color Distribution and Goodness of Fit Test
The second paragraph delves into the specifics of the Chi-Square goodness of fit test. It uses the example of eye color distribution among a sample of adults in Ohio to illustrate how the test works. The paragraph explains the process of setting up hypotheses, checking conditions, calculating expected counts, and determining the Chi-Square statistic and P-value. It concludes with an interpretation of the P-value and making a decision to either reject or fail to reject the null hypothesis based on the significance level.
🔍 Chi-Square Test for Independence and Association
This paragraph explains the Chi-Square test for independence, which is used to determine if two categorical variables are related. The process involves formulating null and alternative hypotheses, checking the conditions for the test, calculating expected frequencies for a contingency table, and using the Chi-Square statistic to compare these with observed frequencies. The paragraph also clarifies how to find the degrees of freedom and make a conclusion based on the P-value and the significance level.
🎯 Conducting a Chi-Square Test for Independence Example
The fourth paragraph provides a step-by-step example of conducting a Chi-Square test for independence using a survey of registered voters in California. It outlines the process of formulating hypotheses, checking conditions, calculating expected counts, determining the Chi-Square statistic, finding the P-value, and making a conclusion. The example concludes that there is a statistically significant association between gender and political party affiliation among the surveyed population.
📈 Chi-Square Test for Homogeneity Across Groups
The fifth paragraph distinguishes the Chi-Square test for homogeneity from the test for independence. It focuses on the scenario where multiple samples from different groups or populations are compared to see if the distribution of a categorical variable is the same across these groups. The paragraph explains the differences in hypotheses and the context of the test, emphasizing that it's about finding differences in distribution rather than association.
📱 Social Media Preferences and Homogeneity Test Example
The sixth paragraph presents an example of a Chi-Square test for homogeneity using data on social media app preferences across different student populations. It walks through the steps of the test, including calculating expected counts, determining the Chi-Square statistic and P-value, and interpreting the results. The conclusion from the example suggests that there is no significant difference in social media preferences across the three student populations.
🏁 Conclusion of Unit 8: Chi-Square Tests
The final paragraph wraps up the unit on Chi-Square tests, summarizing the key points covered in the video. It reiterates the three types of Chi-Square tests: goodness of fit, test for independence, and test for homogeneity. The paragraph highlights the similarities and differences in the processes of these tests, emphasizing the importance of understanding the context and question being asked to choose the correct type of Chi-Square test.
Mindmap
Keywords
💡Chi-Square Test
💡Categorical Variable
💡Goodness of Fit Test
💡Test for Independence
💡Test for Homogeneity
💡Null Hypothesis
💡Alternative Hypothesis
💡Observed Frequencies
💡Expected Frequencies
💡Degrees of Freedom
💡P-Value
Highlights
Unit 8 focuses on the Chi-Square test for categorical data analysis.
The Chi-Square test is used for count data across categorical variables, not for proportions or means.
Three types of Chi-Square tests are discussed: goodness of fit, test for independence, and test for homogeneity.
The Chi-Square test for goodness of fit is used to determine if observed data matches an expected distribution.
The test involves four main steps: naming the test, checking conditions, calculating the Chi-Square value, and making a conclusion.
For a Chi-Square test, the sample must be random, less than 10% of the population, and have five or more expected counts per category.
The Chi-Square test for independence examines the relationship between two categorical variables.
The Chi-Square test for homogeneity assesses if the frequency distribution of a categorical variable is similar across different populations.
The null hypothesis typically states no association or independence, while the alternative suggests an association or difference.
The expected values for each cell in a two-way table are calculated using row and column totals divided by the grand total.
The Chi-Square statistic is calculated by summing the squared differences between observed and expected values, divided by the expected value, for each category.
The P-value is used to determine the significance of the test results, with a low P-value indicating evidence against the null hypothesis.
The degrees of freedom for a Chi-Square test for goodness of fit is the number of categories minus one.
For tests of independence and homogeneity, the degrees of freedom are calculated as (number of rows - 1) * (number of columns - 1).
The decision to reject or fail to reject the null hypothesis is based on comparing the P-value to the significance level (often 1% or 5%).
An example is provided using data on eye color distribution in Ohio to illustrate the Chi-Square goodness of fit test.
Another example examines the association between gender and political party affiliation among registered voters in California.
A third example investigates social media app preferences across different student populations to demonstrate the test for homogeneity.
The video concludes with a summary of the three Chi-Square tests, emphasizing the importance of understanding the context and question for each test.
Transcripts
Browse More Related Video
Chi-Square Tests: Crash Course Statistics #29

Elementary Statistics Lesson #23A

Statistics made easy ! ! ! Learn about the t-test, the chi square test, the p value and more

Degrees Of Freedom in a Chi-Squared Test
Statistics 101: Chi-square in Excel using College Enrollment Data
Elementary Statistics - Chapter 11 Chi Square Goodness of Fit Test
5.0 / 5 (0 votes)
Thanks for rating: