Statistics 101: Chi-square in Excel using College Enrollment Data
TLDRThis educational video introduces the Chi-Square test of independence, focusing on its application in analyzing categorical data to determine if two variables are statistically related. The host guides viewers, particularly beginners, through the process of using Chi-Square in Excel, applying it to a case study of student enrollment changes over five years at a university. The step-by-step tutorial covers everything from setting up contingency tables to calculating the Chi-Square statistic and interpreting the results to reject or accept the null hypothesis.
Takeaways
- 📚 The video is part of a series on basic statistics, aimed at individuals new to the subject.
- 🔢 The presenter uses the term 'stats' for simplicity and provides links to an Excel file for hands-on learning in the video description.
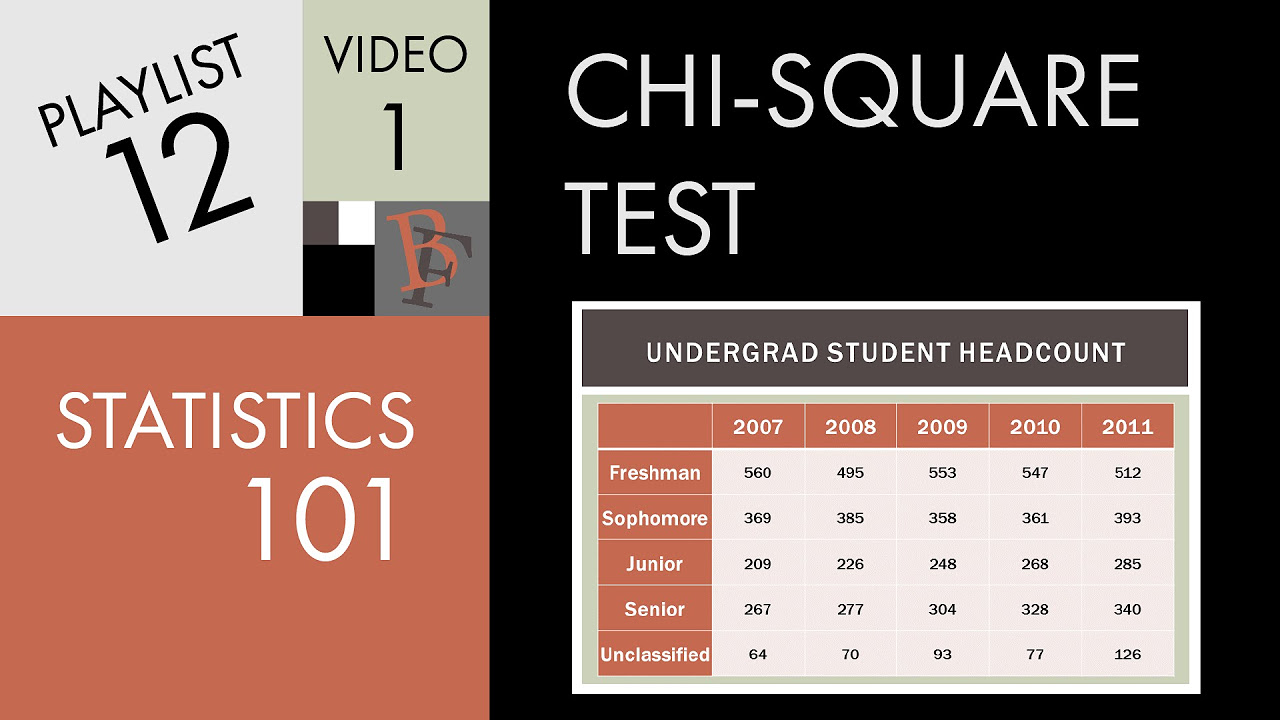
- 📈 The video continues the discussion on the Chi-Square test, specifically focusing on enrollment variation over time categorized by class levels (freshman, sophomore, etc.).
- 🎓 The scenario involves analyzing data from a regional university's institutional research office to determine if changes in student headcount are beyond random chance.
- 🧐 The Chi-Square test is introduced as a method to assess whether two categorical variables are statistically independent or related.
- ❓ The video seeks to answer whether the variation in student enrollment can be attributed to random chance or if there is a significant relationship.
- 📊 Contingency tables are used to organize data and calculate observed versus expected frequencies, which are key to the Chi-Square test.
- 🔑 Degrees of freedom in a Chi-Square test are calculated as (number of columns - 1) * (number of rows - 1) for a table with multiple rows and columns.
- 📝 The video demonstrates step-by-step calculations in Excel, including how to find expected counts and perform Chi-Square computations.
- 📉 The observed data often shows discrepancies from expected values, which are visualized in charts to highlight differences.
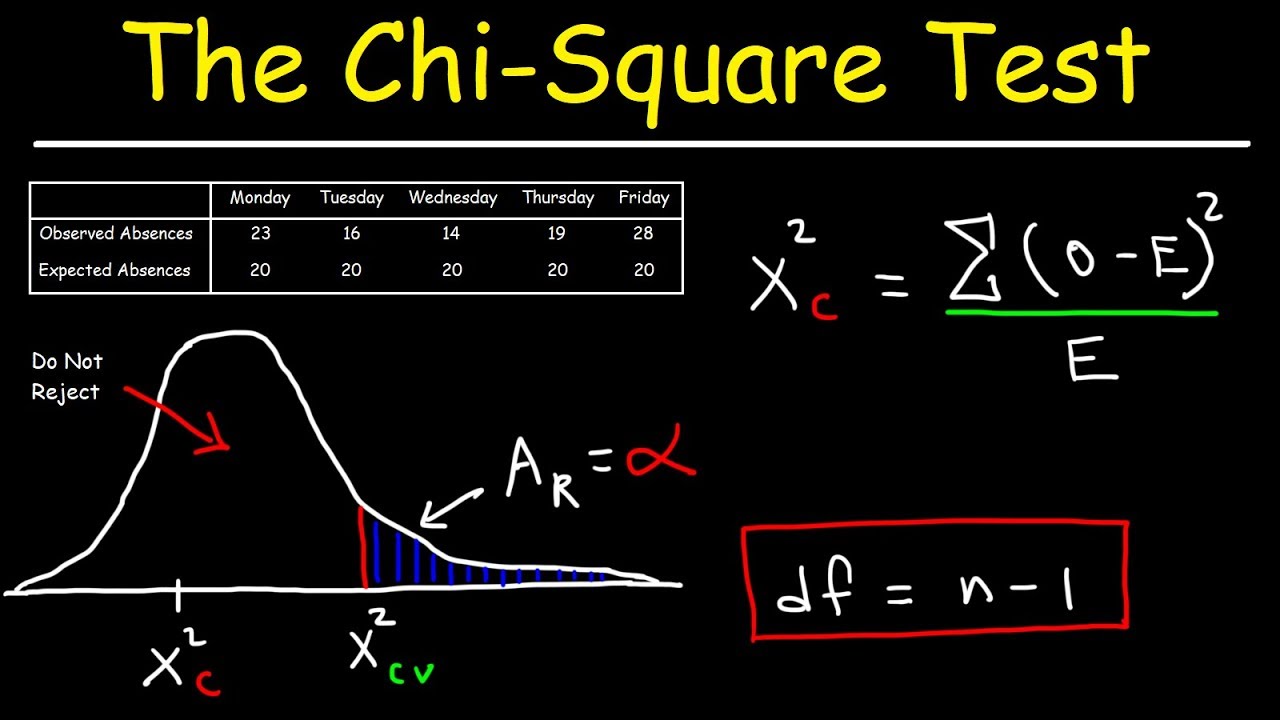
- 🔍 The final Chi-Square statistic is compared against a critical value to determine if the null hypothesis (independence of variables) can be rejected.
Q & A
What is the main focus of the video series on basic statistics?
-The video series focuses on providing an introduction to basic statistics, particularly for individuals who are new to the field. It aims to be accessible and not too advanced, ensuring that the content is suitable for beginners.
Why is the chi-square test being discussed in the video?
-The chi-square test is discussed because it is a statistical method used to determine if there is a significant relationship between two categorical variables, which is a fundamental concept in statistics.
What is the null hypothesis in the context of the chi-square test discussed in the video?
-The null hypothesis in the context of the chi-square test is that the two categorical variables being tested are independent of each other, meaning there is no relationship between them.
What is the alternative hypothesis in the chi-square test?
-The alternative hypothesis is that the two categorical variables are related, indicating that there is a statistically significant relationship between them.
How does the video demonstrate the calculation of expected values in a chi-square test?
-The video demonstrates the calculation of expected values by using a formula that multiplies the row total by the column total and then divides by the grand total for each cell in the contingency table.
What is the purpose of using contingency tables in the chi-square test?
-Contingency tables are used in the chi-square test to organize and display the observed frequencies of categorical variables in a way that facilitates the comparison of observed and expected frequencies.
Why is the chi-square test appropriate for the problem presented in the video?
-The chi-square test is appropriate for the problem because it helps to determine if the variation in student headcount across different class levels and years is beyond what would be expected due to random chance alone.
How does the video use Excel to assist in the chi-square test calculations?
-The video uses Excel to automate the calculations of expected values, observed minus expected values, and the chi-square statistic, making the process more efficient and less prone to manual calculation errors.
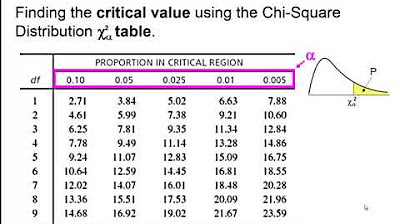
What is the significance of the chi-square critical value in the context of the test?
-The chi-square critical value is the threshold used to determine whether to reject the null hypothesis. If the calculated chi-square statistic is greater than the critical value, the null hypothesis is rejected, indicating a statistically significant relationship between the variables.
What conclusion is drawn from the chi-square test result in the video?
-The conclusion drawn from the chi-square test result is that the class level and year are not independent; there is a statistically significant relationship between them, as the observed differences in student headcount are greater than what would be expected by chance alone.
How does the video address the use of time series categories in chi-square tests?
-The video notes that while it is not common to use time series categories like years in chi-square tests, it is done in this video for demonstration purposes, and it also mentions that certain considerations must be taken into account when using time series data.
Outlines
📚 Introduction to Basic Statistics Series
This paragraph introduces the video series on basic statistics, reminding viewers that the content is tailored for beginners and providing a link to a blog post with an Excel file for interactive learning. The video continues a previous discussion on the Chi-Square test, using undergraduate enrollment data categorized by class level over five years. The aim is to determine if variations in student numbers are beyond those expected by random chance.
🔍 Chi-Square Test of Independence Overview
The paragraph explains the Chi-Square test of Independence, which assesses the relationship between two categorical variables. It emphasizes the test's simplicity, offering a binary outcome of relationship presence or absence. The concept of observed versus expected frequencies is introduced, along with the degrees of freedom in a Chi-Square test, which is calculated as (number of columns - 1) * (number of rows - 1). Several examples of contingency tables are provided to illustrate the application of the test in different scenarios.
📈 Contingency Tables and Observed vs. Expected Data
This section delves into the specifics of contingency tables, highlighting their structure with row and column totals, and how they are used to analyze relationships between categorical variables. The paragraph also discusses the importance of comparing observed data with expected frequencies to determine if the variation is due to chance. It provides a detailed step-by-step guide on calculating expected frequencies using row and column totals divided by the grand total.
📊 Excel Demonstration of Chi-Square Calculation
The speaker transitions to demonstrating the Chi-Square test calculation in Excel, starting with obtaining row and column totals from the observed data. The process of calculating expected counts using Excel formulas is shown, with an emphasis on automating the process for efficiency. The paragraph also covers how to compute the differences between observed and expected values, and the subsequent steps to calculate the Chi-Square statistic for each cell.
🔢 Completing the Chi-Square Calculation in Excel
Continuing the Excel demonstration, the paragraph explains how to fill in the expected headcounts using formulas and autofill features. It details the process of subtracting expected values from observed values and squaring these differences, then dividing by the expected values to complete the Chi-Square calculation. The importance of ensuring the accuracy of these formulas is stressed, with tips on using absolute cell references for consistent calculations.
📉 Analyzing the Chi-Square Results
The paragraph focuses on analyzing the results obtained from the Chi-Square calculation, including summing the values to get the Chi-Square statistic and comparing it with a critical value to determine the significance of the findings. It explains the process of using the CHIINV function in Excel to find the critical Chi-Square value for a given probability and degrees of freedom, and how this value is used to make a decision about the null hypothesis.
📝 Conclusion and Final Thoughts on the Chi-Square Test
In the concluding paragraph, the results of the Chi-Square test are discussed, with a clear explanation of the decision to reject the null hypothesis based on the calculated Chi-Square value exceeding the critical value. The paragraph reinforces the idea that the observed differences in the data are statistically significant and not likely due to chance alone. It ends with a summary of the implications for the relationship between class level and year in the context of the study.
Mindmap
Keywords
💡Basic Statistics
💡Chi-Square Test
💡Contingency Table
💡Degrees of Freedom
💡Observed Frequency
💡Expected Frequency
💡Null Hypothesis
💡Alternative Hypothesis
💡Random Variation
💡Excel
Highlights
Introduction to a series on basic statistics with a focus on individuals new to the subject.
The video is a continuation of a previous one on Chi-Square tests, examining college enrollment over time.
Explanation of the Chi-Square test of Independence and its purpose in determining the relationship between two categorical variables.
The null hypothesis states that two categorical variables are independent, while the alternative hypothesis suggests a relationship.
Use of contingency tables to organize observed and expected frequencies for the Chi-Square test.
Calculation of expected frequencies using the formula involving row totals, column totals, and the grand total.
Excel demonstration on how to calculate expected frequencies and perform Chi-Square computations.
Explanation of degrees of freedom in the context of Chi-Square tests with multiple rows and columns.
Presentation of various examples of contingency tables found in different research contexts.
Analysis of observed versus expected enrollment data in a university over five years.
Graphical representation of enrollment data using line graphs, bar charts, and spider diagrams.
Step-by-step guide on calculating the Chi-Square statistic using observed and expected values.
Comparison of observed and expected headcounts to identify deviations from what would be expected by chance.
Determination of the Chi-Square critical value using Excel functions to assess the null hypothesis.
Rejection of the null hypothesis based on the calculated Chi-Square value exceeding the critical value.
Conclusion that class level and year are statistically related based on the Chi-Square test results.
Transcripts


5.0 / 5 (0 votes)
Thanks for rating: