5 4 Power Calculations for difference of two means
TLDRThis video script discusses the importance of determining an appropriate sample size in clinical trials to ensure an 80% power in detecting significant drug effects. It explains the concepts of type 1 and type 2 errors, significance level (alpha), and power of a test. The script uses an example of a clinical trial for a new blood pressure drug, demonstrating how to calculate standard error, set up hypothesis tests, and determine the required sample size for adequate power. It also highlights the balance between sample size and resources, showing how increasing the sample size can lead to diminishing returns on power after a certain point.
Takeaways
- 🔍 **Importance of Sample Size**: In clinical trials, determining an appropriate sample size is crucial to detect important effects while managing costs and risks.
- 📉 **Risks and Costs**: There's a balance between collecting enough data to detect effects and the potential costs and risks to patients involved in the experiment.
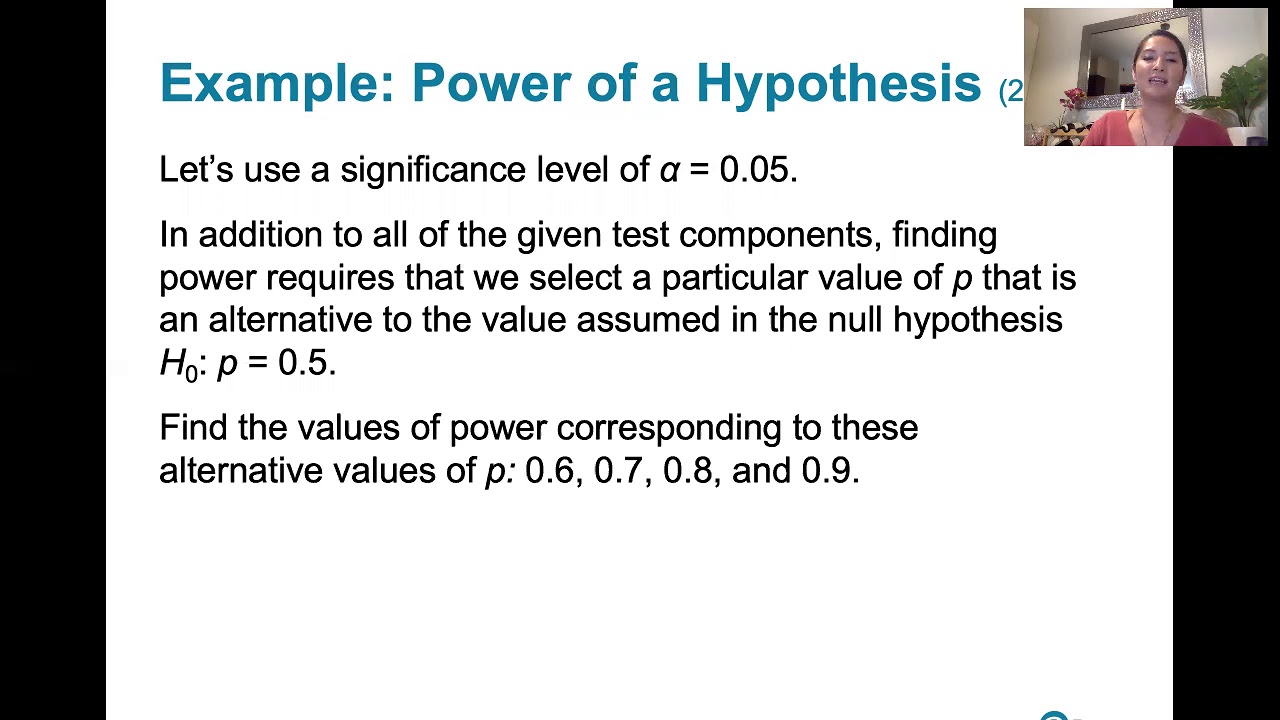
- ⚖️ **Hypothesis Testing**: The video discusses hypothesis testing in the context of clinical trials, focusing on the power of the test and the significance level (alpha).
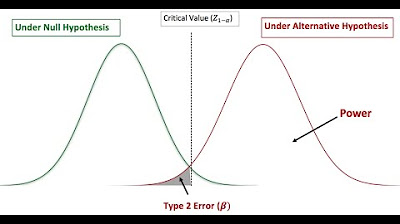
- 🚫 **Type 1 and Type 2 Errors**: Understanding the probability of type 1 (rejecting a true null hypothesis) and type 2 (failing to reject a false null hypothesis) errors is fundamental in designing experiments.
- 💊 **Clinical Trial Design**: The script outlines a scenario where a pharmaceutical company is testing a new blood pressure medication, emphasizing the need for a control and treatment group.
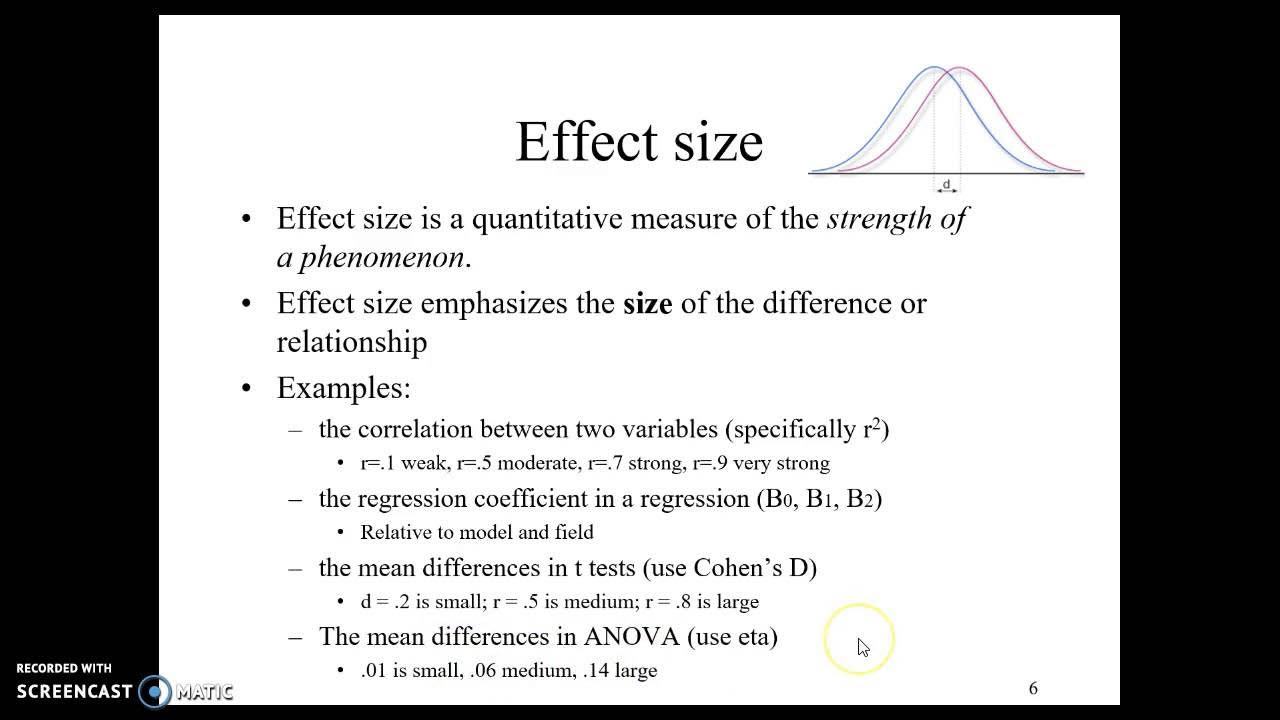
- 📊 **Standard Deviation and Effect Size**: The standard deviation of patient blood pressures and the minimum effect size of interest are key parameters in calculating the required sample size.
- 🎯 **Power of the Test**: The power of a test, defined as 1 minus the probability of a type 2 error, is a measure of the test's ability to detect an effect if there is one.
- 📉 **Sample Size and Power Relationship**: Increasing the sample size can reduce the type 2 error rate, thereby increasing the power of the test, but this comes with increased costs.
- 🧮 **Calculating Sample Size**: The script provides a method for calculating the sample size needed to achieve a desired power level in a clinical trial.
- 📈 **Effect of Sample Size on Power**: The power of the test increases with the sample size up to a point, after which there's a plateau, indicating an optimal sample size for cost-effectiveness.
- ✅ **Practical Application**: The calculations can be used in practice to design studies with a required sample size for a desired level of power or to assess the power for a given sample size.
Q & A
What are the two competing considerations in experiment planning mentioned in the script?
-The two competing considerations are the need to collect enough data to detect important effects and the cost and potential risks associated with data collection, especially in experiments involving human subjects.
What is the significance of an 80% power in a clinical trial?
-An 80% power means that the trial has an 80% probability of correctly rejecting the null hypothesis when the alternative hypothesis is true, which is a commonly required power for most experiments to ensure the study is adequately sensitive to detect important effects.
What are the four possible outcomes when making a decision on a hypothesis test?
-The four outcomes are: 1) Correctly rejecting the null hypothesis when it is false, 2) Correctly not rejecting the null hypothesis when it is true, 3) Making a Type 2 error by failing to reject the null hypothesis when it is false, and 4) Correctly rejecting the null hypothesis when it is false (power of the test).
What is the relationship between the significance level (alpha) and the probability of making a Type 2 error (beta)?
-The significance level (alpha) is the probability of making a Type 1 error, and it is set at the beginning of the test. The probability of making a Type 2 error (beta) is related to alpha in that decreasing alpha increases beta, and vice versa. A larger sample size can help decrease beta while maintaining a low alpha.
In the context of a clinical trial for a new blood pressure drug, what are the hypotheses for a two-sided hypothesis test?
-The null hypothesis states that there is no difference in average blood pressure between the treatment and control groups. The alternative hypothesis states that there is a difference in average blood pressure between the two groups, indicating that the new drug is either better or worse than the existing treatment.
Why is it important to calculate the standard error for the difference in means in a clinical trial?
-Calculating the standard error is crucial for determining the variability of the difference in means between the treatment and control groups. It helps in setting the rejection region for the hypothesis test and is essential for calculating the power of the test.
What is the standard error for the difference in means if there are 100 patients per group, each with a standard deviation of 12 millimeters of mercury?
-The standard error is calculated as the square root of the sum of the variances of the two groups, which is 1.70 millimeters of mercury.
How is the rejection region determined under the normal model for a hypothesis test with a 5% significance level?
-The rejection region is determined by the standard error and the z-score that corresponds to the tail area of 5% for a two-sided test. For a 5% significance level, the rejection region starts at 1.96 times the standard error away from the mean.
What is the minimum effect size of interest for the company researchers in the clinical trial for the new blood pressure drug?
-The minimum effect size of interest is a change in blood pressure of three millimeters of mercury or larger compared to the standard medication.
How can the power of a test be calculated and what does it represent?
-The power of a test is calculated by determining the probability of correctly rejecting the null hypothesis when the alternative hypothesis is true. It represents the test's ability to detect an effect of a given size if it exists.
What is the power of the test when the effect size is negative three millimeters of mercury and each group has a sample size of 100?
-The power of the test in this scenario is approximately 42%, which is calculated by determining the area under the normal curve that corresponds to the z-score for the observed effect size.
How can researchers determine the minimum required sample size to achieve an 80% power for the clinical trial?
-Researchers can work backwards from the desired power to determine the minimum required sample size. This involves calculating the standard error and using the z-score that corresponds to the desired power level (80th percentile) to solve for the unknown sample size.
What sample size is required in each group to detect an effect size of three millimeters of mercury with 80% power?
-At least 251 observations in each group are required to detect an effect size of three millimeters of mercury with 80% power.
How can the calculations for sample size and power be used in practice when designing a study?
-These calculations can be used to determine the required sample size for a desired level of power or to calculate the power for a range of sample sizes and choose the target level of power based on the resources available for collecting the necessary sample size.
What does the power curve show in relation to sample size and the effectiveness of a clinical trial?
-The power curve shows the relationship between sample size and the power of the test. As the sample size increases, so does the power, but only up to a certain point. It helps in deciding the optimal sample size to avoid wasting resources on an unnecessarily large sample size.
Outlines
🔬 Clinical Trials and Sample Size Determination
This paragraph discusses the challenges in planning experiments, particularly clinical trials involving human subjects. It emphasizes the need to balance collecting sufficient data to detect significant effects while managing costs and minimizing risks to participants. The focus is on determining an appropriate sample size to achieve 80% power in a clinical trial, which means being 80% sure of detecting a practically important effect of a drug. The concept of statistical power is explained, alongside other key statistical terms such as type 1 and type 2 errors, significance level (alpha), and the relationship between sample size and power. An example is provided involving a pharmaceutical company testing a new blood pressure drug, where hypotheses for a two-sided hypothesis test are defined, and the standard error for the difference in means is calculated based on the sample size and expected standard deviation of blood pressure readings.
📉 Hypothesis Testing and Power Calculation
The second paragraph delves into the specifics of hypothesis testing, explaining how to determine the rejection region under a normal model and the significance of a two-sided alternative test in clinical trials. It details the process of calculating the power of a test, which is the probability of correctly rejecting the null hypothesis when the alternative hypothesis is true. Using the example of a clinical trial for a blood pressure drug, the paragraph illustrates how to calculate the power when the effect size (difference in average blood pressure) is known. The calculation involves determining the z-score and the corresponding area under the normal curve, which represents the probability of rejecting the null hypothesis given the effect size. The paragraph concludes by emphasizing the importance of selecting an appropriate sample size to ensure the study has sufficient power, and demonstrates how to calculate the required sample size to achieve a desired power level, using the effect size and desired power as inputs.
📊 Power Analysis and Sample Size Determination in Practice
The final paragraph discusses the practical application of power analysis and sample size determination in study design. It explains how to use power calculations to either plan a study with a required sample size for a specific level of power or to evaluate different sample sizes to choose an optimal target power based on available resources. The paragraph presents a graphical representation showing how power increases with sample size up to a certain point, after which it plateaus, indicating the importance of not over-recruiting participants beyond what is necessary to achieve the desired power. This helps in avoiding the waste of resources on an unnecessarily large sample size. The paragraph concludes by highlighting the utility of power analysis in ensuring that a study is well-designed and adequately powered to detect important effects.
Mindmap
Keywords
💡Sample Size
💡Power
💡Type 1 Error
💡Type 2 Error
💡Significance Level (Alpha)
💡Clinical Trial
💡Effect Size
💡Standard Error
💡Null Hypothesis
💡Alternative Hypothesis
💡Two-Sided Hypothesis Test
Highlights
Experiment planning involves balancing data collection for effect detection and cost or risk considerations.
Clinical trials focus on determining an appropriate sample size for an 80% power test to detect important drug effects.
80% power is a commonly required standard for most experiments to ensure reliable results.
Power and significance level (alpha) are key concepts in hypothesis testing, with a trade-off between them.
Type 1 and Type 2 errors are defined, with their probabilities linked to alpha and beta respectively.
Increasing sample size can reduce Type 2 error rate and increase test power.
A pharmaceutical company's clinical trial example illustrates the process of hypothesis testing for a new blood pressure drug.
Null and alternative hypotheses are established for a two-sided test in a clinical trial context.
Standard deviation and distribution symmetry assumptions are crucial for calculating sample size and power.
Standard error calculation is essential for determining the difference in means between treatment and control groups.
Central Limit Theorem is applied to approximate the distribution of sample means for hypothesis testing.
Rejection region under the normal model is determined by the significance level and standard error.
Effect size and minimum effect of interest are identified for calculating the power of the test.
Power calculation involves determining the probability of rejecting the null hypothesis given a true effect size.
Sample size can be adjusted based on desired power to ensure an adequately powered study.
A practical example demonstrates calculating the required sample size for an 80% power clinical trial.
The relationship between sample size, effect size, and power is used to calculate the necessary sample size.
Practical use of sample size and power calculations in study design to avoid underpowered or over-resourced studies.
Graphical representation of power versus sample size helps in making informed decisions on study design.
Transcripts
Browse More Related Video
Power Calculations in Hypothesis Testing | Statistics Tutorial #17 | MarinStatsLectures

Introduction to power in significance tests | AP Statistics | Khan Academy
Power & Effect Size
Power and Sample Size Calculation
8.1.6 Basics of Hypothesis Testing - Power of a Hypothesis Test

Statistical POWER and Power Analysis
5.0 / 5 (0 votes)
Thanks for rating: