Power and Sample Size Calculation
TLDRThis lecture delves into power analysis, a crucial aspect of survey research that determines the ability to detect true associations within a sample. It explains the importance of calculating power and sample size for study justification and grant proposals. The presentation covers the concept of power as the probability of rejecting a false null hypothesis and introduces factors influencing power, such as sample size, effect size, type 1 error rate, and standard error. The lecture provides formulas for calculating power and sample size, demonstrates how to use software like Stata for these calculations, and discusses adjustments for population size, design effects, response rates, and ineligible units to ensure adequate resource allocation.
Takeaways
- 🔍 Power analysis is essential for calculating the sample size needed to detect a specified difference in a study and for justifying resource allocation in grant proposals.
- 🧐 The power of a study is its ability to detect a true association or effect when the exposure of interest is indeed associated with the outcome in the target population.
- 📊 Power is the probability of rejecting the null hypothesis when it is false, and it is typically set at 80% or higher to ensure a study has adequate power.
- 📉 Decreasing the sample size increases the type 2 error and decreases the power, making it harder to distinguish a true effect from random variation.
- 📈 Increasing the sample size is the most direct way to increase power, as larger sample sizes reduce variance and increase the ability to detect true effects.
- 💊 Effect size, such as relative risk, is another factor that can influence power; increasing the effect size can increase power, assuming all else is equal.
- 🔍 Adjusting the critical p-value or type 1 error rate can also affect power; a higher type 1 error rate can increase power but at the cost of more false positives.
- 📐 Standard error can impact power; a larger standard error due to small sample size or high variability can decrease power.
- 📋 Formulas and calculations for power analysis were provided, including those for calculating standard error and power for proportions.
- 🛠 Software like Stata can simplify power calculations and sample size estimation, though understanding the underlying mechanics is important for researchers.
- ⚖️ Sample size adjustments may be necessary after power analysis, considering factors like population size, design effects, response rates, and ineligible units.
Q & A
What is power analysis in the context of research studies?
-Power analysis is a method used to calculate the sample size and power for a study. It helps determine the ability of a study to detect a true association or effect when the exposure of interest is indeed associated with the outcome in the target population.
Why is power analysis important for grant proposals and IRB approval?
-Power analysis is important for justifying the resources needed for a study. When submitting grants or seeking IRB approval, it provides a rationale for resource allocation based on the calculated sample size, which is crucial for the study's feasibility and validity.
What is the relationship between power and sample size in a study?
-Power and sample size are interdependent. Increasing the sample size generally increases the power of a study, because a larger sample size reduces variance, making it easier to distinguish a true effect from random variation.
How is the power of a study related to the probability of committing a Type I or Type II error?
-Power is the probability of rejecting the null hypothesis when it is false, which is the probability of detecting a true association. A Type I error occurs when the null hypothesis is rejected when it is actually true, and a Type II error occurs when the null hypothesis is not rejected when it is false. The critical p-value (Type I error rate) and the power are inversely related to the Type II error rate (beta).
What is the significance of the effect size in power analysis?
-Effect size is a measure of the difference between two groups in a study. It is a key factor in power analysis because it influences the power of the study. A larger effect size makes it easier to detect a true effect, thus increasing the power of the study.
How does the critical p-value or Type I error rate impact the power of a study?
-Decreasing the critical p-value (Type I error rate) increases the Type II error rate (beta), which decreases the power of the study. Conversely, increasing the critical p-value decreases the Type II error rate, which increases the power.
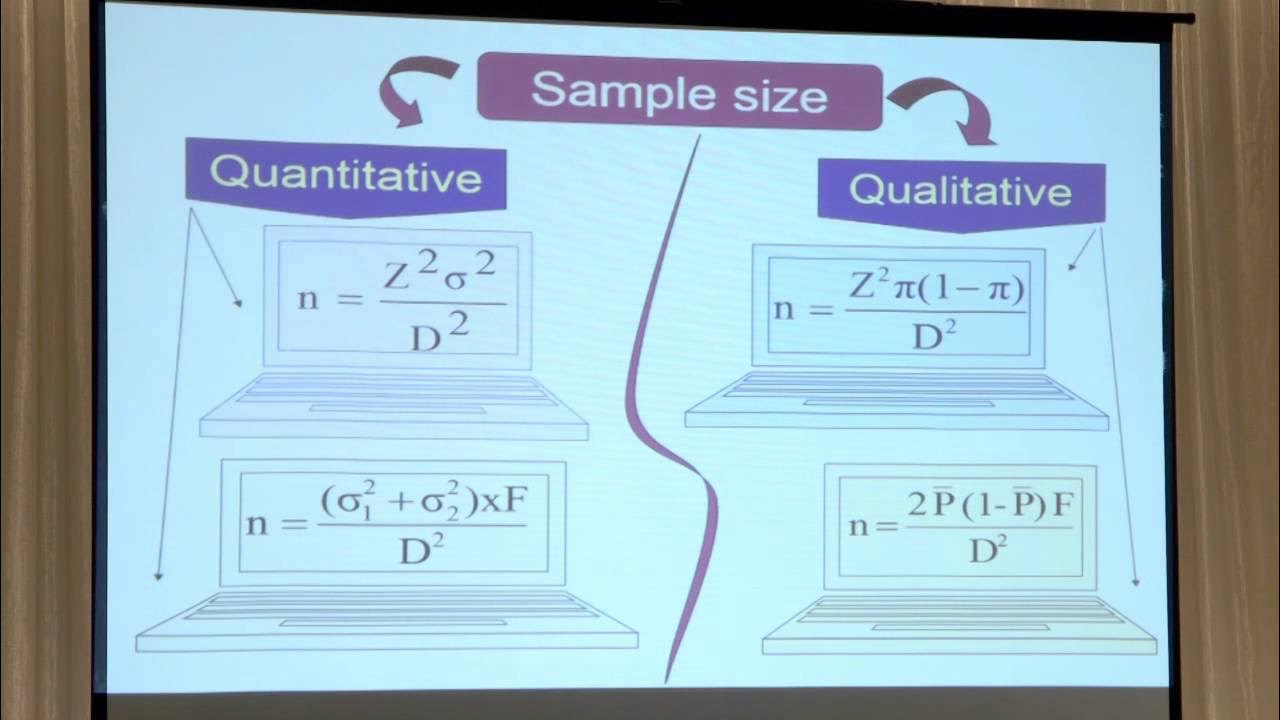
What is the formula used to calculate power based on a given sample size for proportions?
-The formula for calculating power for proportions involves the Z-score for the specified Type I error rate (Z 1 - alpha), the standard error under null and alternative hypotheses, and the difference in proportions (P). It uses the arcsine transformation for calculating the effect size.
Can you provide an example of how to calculate power using software like Stata?
-In Stata, you can calculate power using the 'power' command followed by the specific parameters. For example, 'power to proportions' can be used to calculate power for a study comparing two proportions, where you specify the baseline risk and the relative risk of interest.
What adjustments are typically made to the sample size after conducting power analysis?
-Adjustments to the sample size after power analysis may include finite population correction, design effect adjustment for cluster sampling, response rate adjustment, and adjustment for ineligible units. These adjustments help ensure that the sample size is adequate for the study's needs.
How can a researcher decide on the appropriate effect size for their study?
-Researchers can refer to established rules of thumb or guidelines from previous studies and literature. For example, small effect sizes are often considered less than 0.5, medium effect sizes around 0.5 to 0.8, and large effect sizes greater than 0.8 for means or proportions.
Outlines
🔍 Introduction to Power Analysis and Sample Size Calculation
This paragraph introduces the concept of power analysis and its importance in research studies. Power analysis helps determine the sample size needed to detect a specified difference between groups or to assess if the current sample size has adequate power to discriminate between effects. It's crucial for justifying resource allocation in grant proposals and IRB approvals. The paragraph explains the motivation behind power analysis, its role in hypothesis testing, and the significance of rejecting the null hypothesis when it is false. It also touches upon the impact of sample size on power, emphasizing that a larger sample size leads to greater power and a better ability to distinguish true effects from random variation.
📊 Understanding Power Analysis and Its Determinants
This section delves deeper into power analysis, explaining how it's calculated and the factors that influence it. Power and sample size are interdependent, and increasing the sample size is the most straightforward way to increase power. The paragraph discusses the effect of sample size on power through graphical representations, illustrating how decreasing sample size increases type 2 error and decreases power. It also covers other factors that affect power, such as effect size, critical p-value (type 1 error rate), and standard error. The importance of understanding these factors is highlighted for researchers to effectively plan and justify their study designs.
🧮 Formulas and Calculations for Power and Sample Size
This paragraph provides the mathematical formulas for calculating power and sample size. It explains the process of calculating power based on a given sample size and vice versa. The formulas require values such as the Z-score, standard error under null and alternative hypotheses, and mean differences. The paragraph also presents a specific example using proportions to illustrate the calculation process. It emphasizes the importance of understanding these calculations, even though software like Stata can perform them, to grasp the underlying mechanics of power analysis.
📈 Practical Application of Power Analysis in Research
The focus of this paragraph is on the practical application of power analysis in research, particularly when submitting grant proposals. It discusses the process of calculating sample size to detect a true difference between groups and the importance of determining test statistics such as mean, proportion, or relative risk. The paragraph uses the example of a study on the effect of vitamin D on tuberculosis cure rates to demonstrate the calculation of power and sample size, highlighting the need for sufficient power to ensure the study's validity.
🛠 Adjustments and Considerations in Power Analysis
This final paragraph discusses the necessary adjustments and considerations that follow power analysis. It covers adjustments for finite population correction, design effect, response rate, and ineligible units. The paragraph emphasizes the importance of these adjustments in ensuring that the study's sample size is appropriate and that the resources allocated are sufficient. It also encourages researchers to keep an eye on costs and make necessary adjustments based on funding limits.
Mindmap
Keywords
💡Power Analysis
💡Sample Size
💡Effect Size
💡Type 1 Error (Alpha)
💡Type 2 Error (Beta)
💡Null Hypothesis
💡Alternative Hypothesis
💡Critical Value
💡Standard Error
💡Relative Risk
💡Finite Population Correction (FPC)
💡Design Effect
💡Response Rate
💡Eligibility
Highlights
Power analysis is essential for calculating power and sample size in research studies and grant proposals.
Sample size calculation is crucial for justifying resource allocation in research.
Power of a study is its ability to detect a true association or effect when it exists in the target population.
The effect observed in a study could be due to random chance, necessitating a sufficiently large sample size.
Power analysis helps to determine the probability of rejecting the null hypothesis when it is false.
Type 1 error (alpha) is usually set at 0.05 or 5%, representing the probability of a false positive.
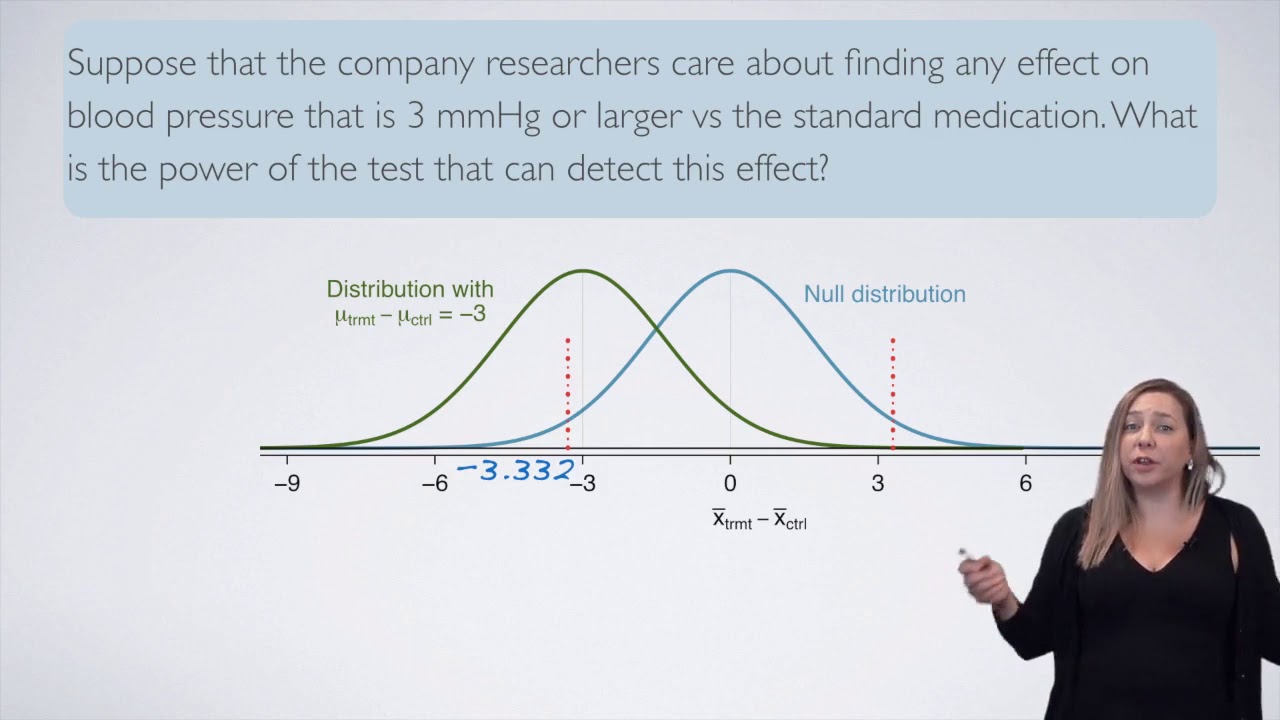
Power is the area under the curve to the right of the critical value, representing the probability of detecting a true association.
Increasing sample size is a primary way to increase power in a study.
Effect size and sample size are interdependent, with larger sample sizes leading to greater power.
Decreasing sample size leads to an increase in type 2 error and a decrease in power.
Increasing the effect size can also increase power, by reducing the overlap between null and alternative distributions.
Adjusting the critical p-value or type 1 error rate can influence power, with higher rates leading to more power at the cost of more false positives.
Standard error can affect power, with higher variability in the population requiring larger sample sizes.
Cluster sampling and adjusting for design effects can be necessary when dealing with subgroups in the population.
The best way to increase power is by increasing sample size, which is under the researcher's control.
Power analysis can be conducted using formulas and hand calculations or with the aid of software like Stata.
Sample size calculation often involves determining the type 1 error, power, effect size, and proportions in the exposed and unexposed groups.
Effect size can be calculated using the arcsine transformation for proportions or the difference in means for other measures.
Adjustments to sample size may be necessary after power analysis, including for finite population correction, design effect, response rate, and ineligible units.
Cost and resource availability must be considered when making adjustments to sample size and study design.
Transcripts
Browse More Related Video

Introduction to power in significance tests | AP Statistics | Khan Academy
Power Calculations in Hypothesis Testing | Statistics Tutorial #17 | MarinStatsLectures

Power Analysis
8.1.6 Basics of Hypothesis Testing - Power of a Hypothesis Test
5 4 Power Calculations for difference of two means
Calculating Sample Size
5.0 / 5 (0 votes)
Thanks for rating: