Statistics made easy ! ! ! Learn about the t-test, the chi square test, the p value and more
TLDRThis video script offers an accessible introduction to statistics, emphasizing a conceptual understanding over complex formulas. It covers the basics of analyzing sample data, identifying differences between groups, and relationships between variables. The script explains the importance of hypothesis testing and statistical significance, and introduces various statistical tests such as chi-square, t-test, and ANOVA. It also touches on the concept of correlation and the correlation coefficient, providing a foundation for further exploration in statistical analysis.
Takeaways
- 📊 Learning statistics involves understanding how to analyze sample data to address common questions about differences between groups and relationships between variables.
- 🔍 The 'real' in statistics refers to determining whether observed differences and relationships are statistically significant and not just due to chance.
- 📈 To analyze data, start by summarizing and visualizing it using tables, bar charts, box plots, and histograms to make it more comprehensible.
- 📐 Categorical variables are data that can be grouped into categories (e.g., gender), while numeric variables are measured on a scale (e.g., height).
- 🌟 The process of summarizing data transforms it from raw numbers into meaningful insights that can be understood and analyzed.
- 🔢 When examining data, consider various combinations of variables to identify specific differences and relationships.
- 🧠 Statistical tests are used to determine if the observed data in a sample has implications for the wider population.
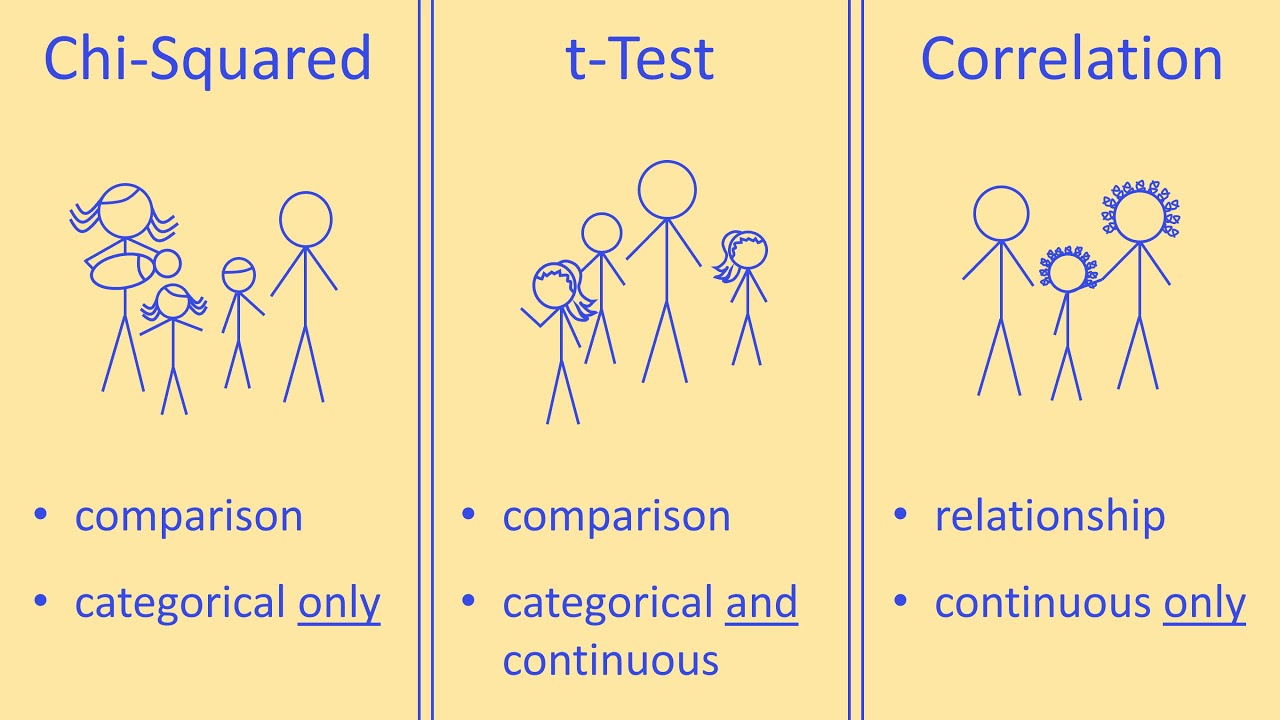
- 🌐 For different combinations of data types, different statistical tests are applied: one-sample proportion test for categorical, chi-square test for two categorical, t-test for single numeric, t-test or ANOVA for one categorical and one numeric, and correlation test for two numeric variables.
- 💡 Before analyzing data, define your hypothesis, null hypothesis, and alpha value to guide your statistical analysis.
- 🎯 The p-value, compared to the alpha value, helps determine if the observed results are statistically significant enough to reject the null hypothesis.
- 📚 Further learning in statistics and programming for statistical analysis is available through online courses and resources.
Q & A
What is the main goal of learning statistics through the lens of the transcript?
-The main goal is to develop a way of thinking that enables one to address common statistical questions when analyzing sample data, rather than focusing solely on complicated formulas and theories.
What are the two types of variables typically found in a data set?
-The two types of variables are categorical variables, like gender, and numeric variables, like height.
How can categorical data be summarized and visualized?
-Categorical data can be summarized by counting the number of observations in each category and visualized using a table or a bar chart.
What are some summary measures for numeric data?
-Summary measures for numeric data include the range, interquartile range, standard deviation, median, and mean.
How can we determine if the differences or relationships observed in sample data are statistically significant?
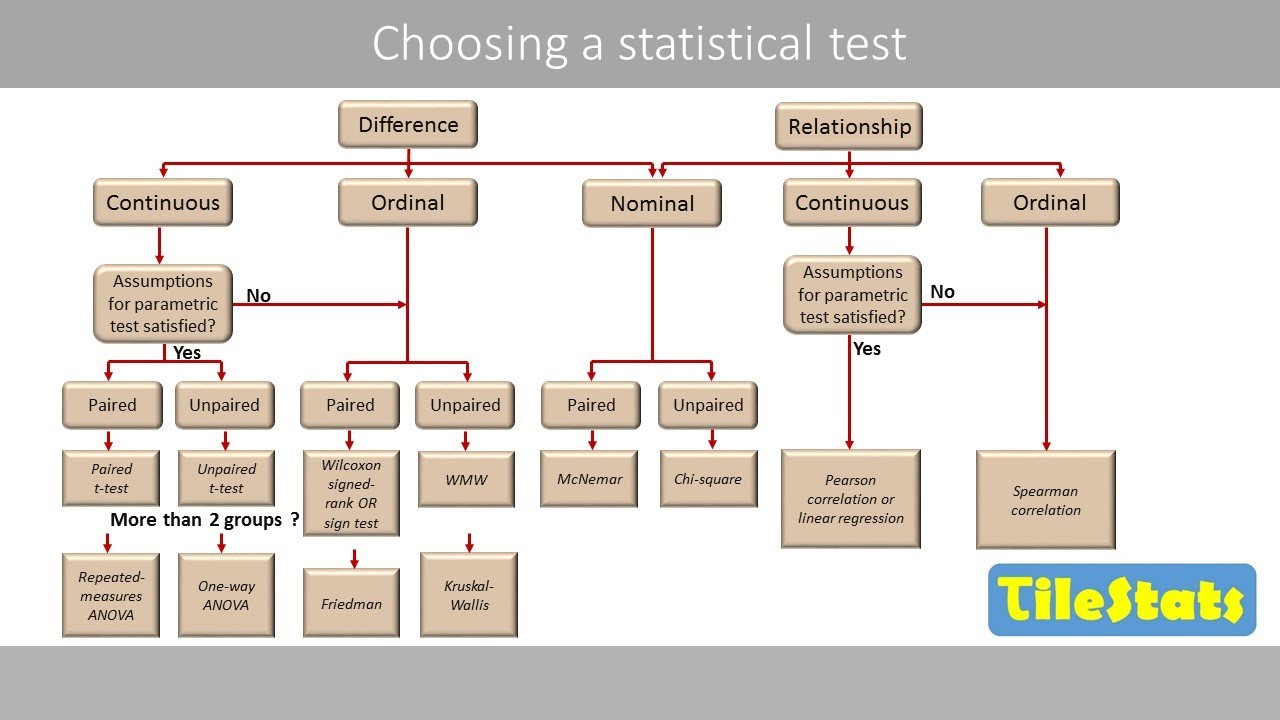
-We can apply specific statistical tests, such as t-tests, ANOVA, or correlation tests, to determine if the observed differences or relationships are statistically significant.
What is the null hypothesis in the context of analyzing categorical variables like gender?
-The null hypothesis is that there is no difference in the number of men and women in the population.
What is the role of the p-value in statistical testing?
-The p-value helps determine the likelihood of observing the current results or more extreme results if the null hypothesis were true. If the p-value is less than the alpha value, we can reject the null hypothesis.
What is the alternative hypothesis in the context of analyzing numeric variables like height?
-The alternative hypothesis is that there is a difference in the average height from a previously established height or a theoretical value.
How does the chi-square test help in analyzing relationships between categorical variables?
-The chi-square test helps determine if there is a significant association between two categorical variables, such as whether the proportion of males and females differs across age groups.
What is the correlation coefficient, and what does it represent?
-The correlation coefficient is a number between -1 and 1 that represents the nature and strength of the relationship between two numeric variables. A positive coefficient indicates a positive correlation, a negative coefficient indicates a negative correlation, and a coefficient close to 0 indicates no correlation.
How can one further their understanding of statistical analysis beyond the content provided in the transcript?
-One can visit learnmore365.com for courses on statistical analysis and check out the YouTube channel 'Programming 101' for learning about R, a programming language used for statistical analysis.
Outlines
📊 Introduction to Statistical Thinking
This paragraph introduces the concept of learning statistics through a practical approach rather than complex formulas and theories. It emphasizes understanding differences between groups and relationships between variables within sample data. The speaker aims to clarify whether observed differences and relationships are real. The paragraph sets the stage for discussing statistical tests and their interpretation, using a hypothetical research question about the height and weight of people in Ireland. It explains the process of collecting data from a random sample, categorizing data into variables, and the importance of summarizing and visualizing data to make it meaningful.
🧬 Variables and Statistical Significance
The second paragraph delves into the types of variables encountered in data sets—categorical and numeric—and how they are summarized and visualized. It explains the concepts of categorical data representation through tables and bar charts, and numeric data through range, interquartile range, standard deviation, median, and mean, with corresponding visualizations like box plots and histograms. The paragraph also introduces the idea of statistical significance, discussing how to determine if observed differences or relationships in sample data are statistically significant for the wider population. It outlines different statistical tests for various combinations of data types, such as one-sample proportion test, chi-square test, t-test, ANOVA, and correlation test.
🔬 Hypothesis Testing and Correlation Analysis
This paragraph focuses on hypothesis testing, starting with defining a research question and null hypothesis, and the importance of setting an alpha value before data analysis. It explains the process of conducting statistical tests, such as one-sample proportion test and chi-square test, and interpreting the results through p-values. The paragraph also discusses analyzing numeric data, comparing theoretical values, and using t-tests for differences. It further explores the relationship between categorical and numeric variables, like gender and height, and introduces ANOVA for categorical variables with more than two categories. The concept of correlation between two numeric variables is introduced, explaining the correlation coefficient and its interpretation. The paragraph concludes with resources for further learning in statistical analysis and programming.
Mindmap
Keywords
💡Statistics
💡Categorical Variables
💡Numeric Variables
💡Data Summary
💡Statistical Tests
💡Null Hypothesis
💡p-value
💡Alpha Value
💡Correlation Coefficient
💡Chi-Square Test
💡Analysis of Variance (ANOVA)
Highlights
Learning statistics can be straightforward by focusing on ways of thinking rather than complex formulas and theories.
Statistical analysis often involves examining differences between groups and relationships between variables.
The process begins by understanding the data through variables, which are organized in columns in a spreadsheet or dataset.
Categorical variables, like gender, are grouped into categories, while numeric variables, like height, are represented by numbers.
To summarize data, categorical variables can be tallied and visualized using bar charts, while numeric variables can be described using range, interquartile range, standard deviation, median, and mean.
Box plots and histograms are useful for visualizing the distribution and shape of numeric data.
Statistical tests are applied to determine if observed differences or relationships in sample data are statistically significant and can be inferred to the wider population.
The five most important combinations of data types for statistical analysis include single categorical, two categorical, single numeric, one categorical and one numeric, and two numeric variables.
Before analyzing data, it's crucial to define the research question, hypothesis, null hypothesis, and alpha value.
A one sample proportion test is used for a single categorical variable to determine if there's a difference in population proportions.
For two categorical variables, a chi-square test is applied to see if the proportions differ across groups.
A t-test is used for a single numeric variable to compare the sample mean to a theoretical value.
When comparing the average of a categorical and a numeric variable, such as gender and height, a t-test or ANOVA is used if there are more than two categories.
For two numeric variables, a correlation test is conducted to determine if there's a relationship between them, represented by a correlation coefficient.
The correlation coefficient ranges from -1 to 1, indicating the nature and strength of the relationship between variables.
Statistical analysis transforms raw data into meaningful insights that can be understood and acted upon.
BMC is a sponsor of the video, known for publishing open access journals that make research freely available worldwide.
The video encourages further learning in statistics and programming, directing viewers to relevant courses and resources.
Transcripts
Browse More Related Video

Inferential Statistics FULL Tutorial: T-Test, ANOVA, Chi-Square, Correlation & Regression Analysis
Choosing a Statistical Test for Your IB Biology IA
How to choose an appropriate statistical test

SPSS (9): Mean Comparison Tests | T-tests, ANOVA & Post-Hoc tests

T-test, ANOVA and Chi Squared test made easy.

How To Know Which Statistical Test To Use For Hypothesis Testing
5.0 / 5 (0 votes)
Thanks for rating: