Effect size in meta analysis
TLDRThis script delves into the concept of effect size in meta-analysis, a critical statistical measure that quantifies the strength of a relationship or difference between variables. It explains how effect size is calculated for both continuous data using standardized mean differences like Hedges' G, Cohen's d, and Glass's Δ, and binary data using odds ratios. The script highlights the importance of effect size in evaluating the significance of observed effects beyond just p-values, offering a standardized method to assess the impact of treatments or interventions on outcomes. It also touches on the use of Pearson's correlation coefficient and Fisher's Z transformation for analyzing the relationship between continuous variables in meta-analysis.
Takeaways
- 📐 **Effect Size Definition**: Effect size is a statistical measure that quantifies the magnitude or strength of a relationship between two variables, such as an experimental variable and an outcome variable.
- 🌟 **Importance in Research**: Effect size is crucial in research and meta-analysis as it provides a standardized way to evaluate the significance of observed effects beyond just p-values.
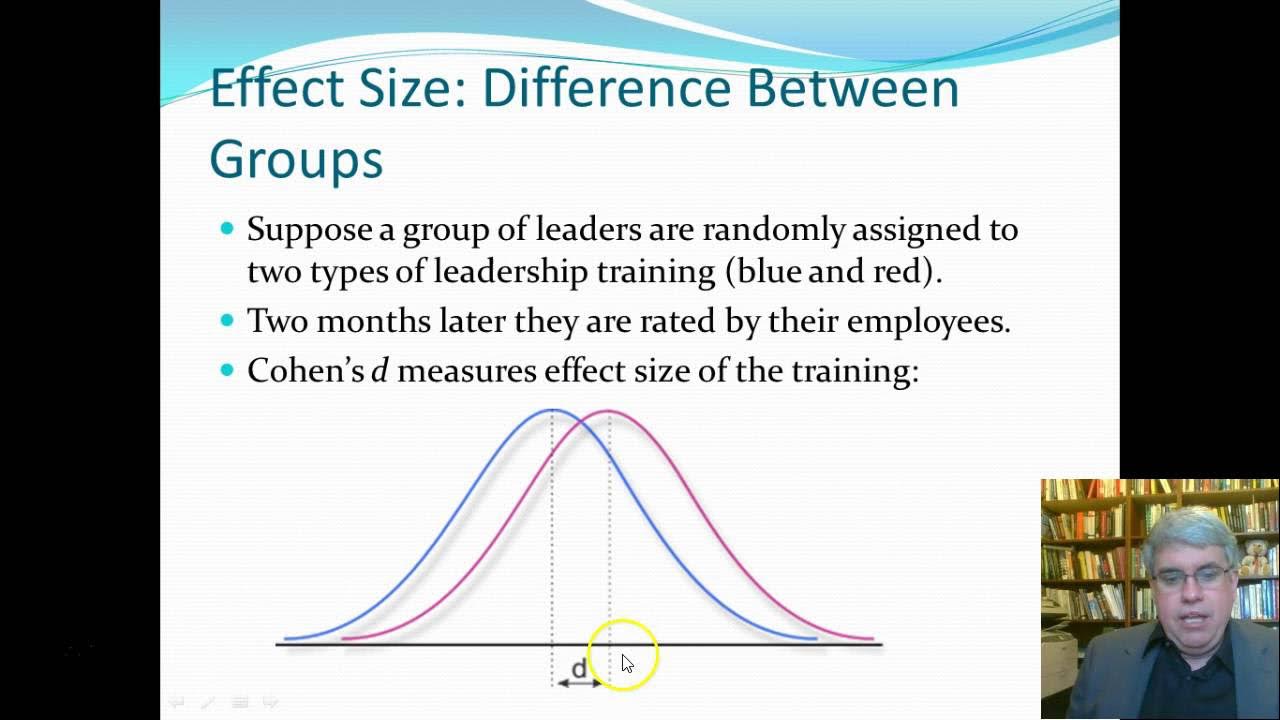
- 📊 **Continuous Data Effect Sizes**: For continuous data, the mean difference between two groups can represent the effect size, with larger differences indicating stronger relationships.
- 🔢 **Standardized Mean Difference (SMD)**: SMD is used when combining studies that measure the same variable in different units, calculated by dividing the mean difference by the pooled standard deviation.
- ⚖️ **Hedges' g, Cohen's d, and Glass' Δ**: These are common SMDs used in meta-analysis, chosen based on the sample size and the standard deviation difference between groups.
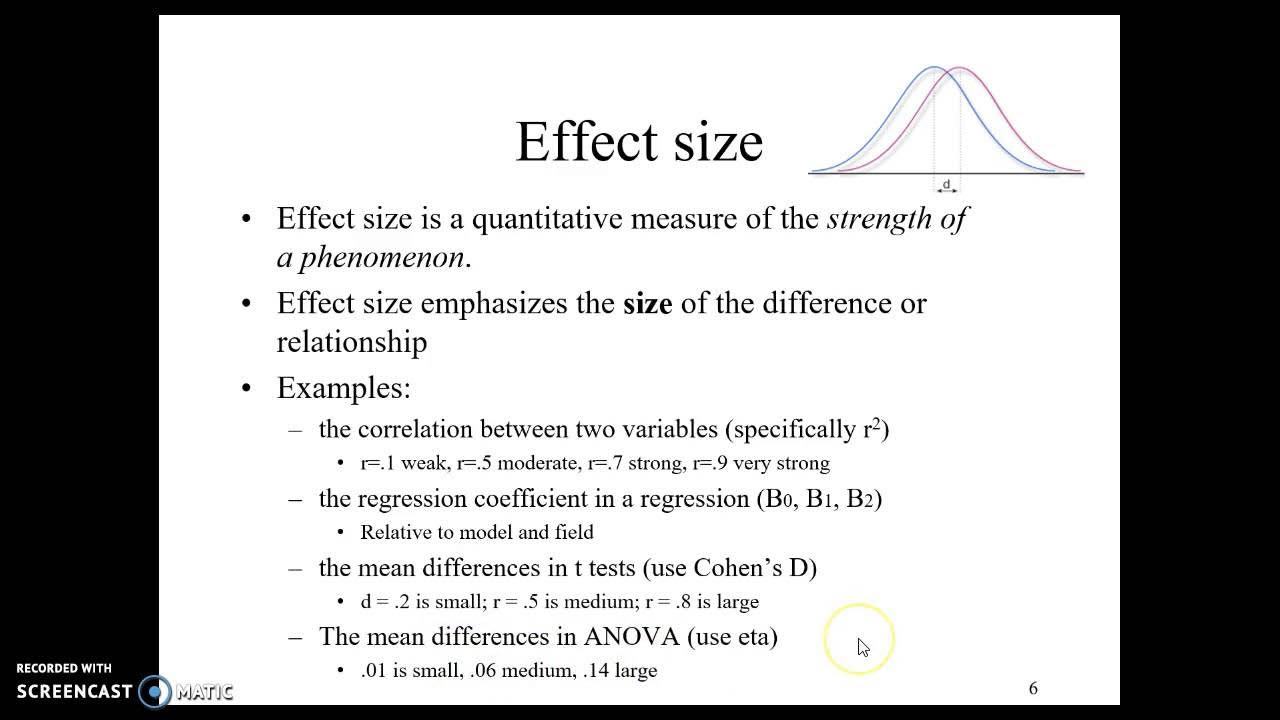
- 🤝 **Correlation Coefficient**: When establishing a relationship between two continuous variables, the Pearson correlation coefficient represents the effect size, indicating the strength and direction of the relationship.
- 🔁 **Fisher's Z Transformation**: Used to transform correlation coefficients into a more normally distributed variable for use in standard meta-analysis procedures.
- 🎯 **Binary Outcome Effect Sizes**: Odds Ratio (OR), Risk Ratio (RR), and Hazard Ratio are used for binary or categorical outcomes to estimate the likelihood of an event occurring in one group relative to another.
- 📈 **Effect Size Estimation**: Effect sizes can estimate the extent of influence an independent variable (like a treatment) has on a dependent variable (like an outcome).
- 📜 **Meta-Analysis Application**: In meta-analysis, effect sizes from multiple studies are combined to produce an overall estimate of the effect size, providing a comprehensive view of the evidence.
- 📌 **Effect Size Interpretation**: A larger effect size suggests a stronger relationship or larger differences between variables, while a smaller effect size indicates a weaker relationship or smaller differences.
Q & A
What is the effect size in the context of research studies and meta-analysis?
-Effect size is a statistical measure that quantifies the magnitude or strength of a relationship between two variables, such as an experimental variable and a group variable. It also quantifies the difference between two groups, particularly when dealing with normally distributed continuous data.
How does the difference between the means of two groups relate to the effect size?
-The difference between the means of two groups can reflect or represent the effect size. A larger difference indicates a stronger relationship or larger differences between variables, whereas a smaller difference indicates a weaker relationship.
What is the role of effect size in evaluating significant results in a study?
-While a significant p-value indicates that the results are not due to chance, the effect size provides a standardized way to evaluate the magnitude of the observed effect, showing to what extent the independent variable influences the dependent variable.
How is the effect size used in meta-analysis?
-In meta-analysis, effect sizes from multiple studies are combined to produce an overall estimate of the effect size. This allows for a more comprehensive understanding of the strength and consistency of the relationship across different studies.
What are the common types of effect sizes used in practice?
-Common effect sizes include Standardized Mean Difference (SMD), Odds Ratio (OR), Risk Ratio (RR), and Correlation Coefficient based on the Pearson correlation coefficient. These are used depending on whether the data are continuous or categorical.
What is the Standardized Mean Difference (SMD) and when is it used?
-The Standardized Mean Difference (SMD) is used when the variables or data are continuous. It quantifies the difference between the means of two groups by dividing the mean difference by the pooled standard deviation of both groups.
What is Hedges' g and how is it calculated?
-Hedges' g is a statistical method used to determine standardized differences between two means when the data are continuous. It is calculated by taking the difference between the means of the experimental and control groups and dividing it by the corrected standard deviation, which accounts for sample size and degrees of freedom.
What is Cohen's d and how does it differ from Hedges' g?
-Cohen's d is another method for calculating effect size, similar to Hedges' g, but it uses the pooled standard deviation instead of the pooled weighted standard deviation. It is used to determine the effect size of an intervention or treatment compared to a control.
What is the Glass's Δ and when should it be used?
-Glass's Δ is a method for calculating effect size that takes into account the size of the control group. It is used when the standard deviations are significantly different between two groups and is calculated by dividing the difference between the means by the standard deviation of only the control group.
How is the Odds Ratio (OR) used in meta-analysis?
-The Odds Ratio (OR) is used when the outcome variable is binary or categorical. It measures the strength of the association between two binary variables, such as exposure and outcome, and estimates the likelihood of an event occurring in one group relative to another.
What is the Pearson correlation coefficient and how is it used in meta-analysis?
-The Pearson correlation coefficient (r) measures the strength and direction of a linear relationship between two continuous variables. It is used as an effect size estimate to indicate the magnitude and direction of the relationship. The value of r can range from -1 to 1, with 0 indicating no relationship.
What is Fisher's Z transformation and why is it used in meta-analysis?
-Fisher's Z transformation is a method used to transform the Pearson correlation coefficient into a more normally distributed variable. This transformation is performed to compute the summary effect size across studies in a meta-analysis, making it easier to combine and compare effect sizes.
Outlines
📊 Understanding Effect Size in Research
This paragraph introduces the concept of effect size as a critical statistical measure in research studies and meta-analyses. It explains that effect size quantifies the strength or magnitude of a relationship between two variables, such as an experimental variable and a group variable, or exposure and outcome. It also clarifies that effect size can represent the difference between two group means, especially when the data is continuous and normally distributed. The paragraph further discusses how effect size can be used to estimate the likelihood of an event in binary or dichotomous categorical data through odds ratios. It emphasizes the importance of effect size in evaluating the significance of observed effects beyond just p-values, by providing a standardized measure of the influence of an independent variable on a dependent variable.
🔍 Effect Size: Larger vs. Smaller Implications
This section delves into the implications of larger and smaller effect sizes, indicating that a larger effect size suggests a stronger relationship or more significant differences between variables, while a smaller effect size points to weaker relationships or less pronounced differences. It discusses how effect sizes from multiple studies are pooled in meta-analyses to calculate an overall estimate. The paragraph outlines common effect sizes used in practice, such as the standardized mean difference (SMD), the odds ratio (OR), the risk ratio (RR), and the hazard ratio, each suited to different types of data and research designs. It also highlights the standardized mean difference as a method for combining studies that measure the same variable with different units of measurement.
📐 Calculating Standardized Mean Differences
The third paragraph focuses on the calculation and types of standardized mean differences (SMDs) used in meta-analysis when dealing with continuous data. It introduces Hedges' g (HSG), Cohen's d (CD), and Glass's Δ (GD) as common SMDs, explaining that HSG is preferred for small sample sizes due to its use of a corrected standard deviation that accounts for sample size and degrees of freedom. The paragraph provides the formula for calculating HSG and explains its interpretation, noting that positive and negative values indicate the relative magnitude of difference between groups, with zero indicating no difference.
📉 Cohen's d, Glass's Δ, and Choosing the Right Effect Size
This section compares Cohen's d and Glass's Δ with Hedges' g, explaining the subtle differences in their calculations and applications. Cohen's d uses the pooled standard deviation without weighting, making it suitable for larger sample sizes, while Glass's Δ considers the control group's standard deviation and is chosen when there's a significant difference in standard deviations between groups. The paragraph offers guidance on selecting the appropriate effect size estimator based on sample size and the homogeneity of variances, providing a clear decision-making process for researchers.
🎲 Odds Ratio and Binary Outcomes in Effect Size
The fifth paragraph shifts the focus to binary outcomes and introduces the odds ratio (OR) as a measure of effect size for binary variables. It explains how the OR quantifies the strength of the association between exposure and outcome, estimating the likelihood of an event occurring in one group relative to another. The OR is particularly used in case-control studies, and its values can range from zero to infinity, with a value of 1 indicating no association. The paragraph also discusses the interpretation of OR values, highlighting the implications of values greater than or less than one.
🧭 Pearson Correlation Coefficient and Fisher's Z Transformation
The final paragraph discusses the Pearson correlation coefficient as a measure of effect size for the relationship between two continuous variables. It describes how the correlation coefficient (r) indicates the strength, direction, and magnitude of a linear relationship, with values ranging from -1 to 1. The paragraph also introduces Fisher's Z transformation, a method for converting correlation coefficients into a more normally distributed variable suitable for meta-analysis. This transformation allows for the computation of a summary effect size across studies, rounding out the discussion on effect size estimation in various research contexts.
Mindmap
Keywords
💡Effect Size
💡Meta-Analysis
💡Standardized Mean Difference (SMD)
💡Hedges' G
💡Cohen's d
💡Glass's Δ
💡Odds Ratio (OR)
💡Risk Ratio (RR)
💡Pearson Correlation Coefficient
💡Fisher's Z Transformation
Highlights
Effect size is a statistical measure that quantifies the magnitude or strength of a relationship between two variables.
Effect size is used to quantify the difference between two groups with normally distributed, continuous data.
The difference between the means of two groups can represent the effect size, indicating the strength of the difference.
Effect size estimates the likelihood of an event occurring in one group relative to another, particularly useful for binary or dichotomous outcomes.
Standardized mean difference (SMD), odds ratio (OR), and correlation coefficient are common effect sizes used in meta-analysis.
Hedges' g (Hsg) is an SMD used when the sample size is small, providing a more accurate estimate of the population effect size.
Cohen's d is an effect size used to determine the effect of an intervention or treatment compared to control, often used in meta-analysis.
Glasses' Delta takes into account the size of the control group and is used when there are significant differences in standard deviations.
The odds ratio (OR) is used for binary outcomes and measures the strength of the association between two binary variables.
Pearson's correlation coefficient (r) is used to measure the strength and direction of a linear relationship between two continuous variables.
Fisher's Z transformation is used to transform correlation coefficients for standard meta-analysis procedures.
Effect size provides a standardized way to evaluate significant observed effects in a study or experiment.
Larger effect sizes suggest stronger relationships or larger differences between variables.
Smaller effect sizes indicate weaker relationships or smaller differences between control and treatment groups.
Effect sizes from multiple studies are combined in meta-analysis to produce an overall estimate of the effect size.
Hsg, Cohen's d, and Glass' Delta are the three common SMDs used in practice when performing meta-analysis.
The choice between Hsg, Cohen's d, and Glass' Delta depends on sample size and the significance of differences in standard deviations.
The Pearson correlation coefficient ranges from -1 to 1, with values indicating the strength and direction of the relationship between variables.
Transcripts


5.0 / 5 (0 votes)
Thanks for rating: