Elementary Statistics Lesson #23A
TLDRIn this educational video, the instructor concludes the semester with a lesson on hypothesis testing, specifically focusing on the chi-square goodness-of-fit test. The lesson explains the concept of hypothesis testing, differentiates between t-tests and z-tests, and introduces the chi-square distribution. It demonstrates how to calculate expected counts, the chi-square test statistic, and interpret the results using either a p-value approach or a critical value method. The video uses real-world examples, such as testing a die for fairness and analyzing FBI crime data, to illustrate the application of the chi-square test.
Takeaways
- 📊 Lesson 23 focuses on the final hypothesis test of the semester, specifically the goodness-of-fit test.
- 📈 Previous lessons covered t-tests for population means and z-tests for proportions, relying on t-distribution and standard normal z distribution respectively.
- 📉 The chi-square distribution is introduced for qualitative or categorical variables, different from the t and z distributions.
- 🔢 Chi-square test statistics are used to determine if observed frequencies match expected frequencies in categorical data.
- 📏 The chi-square distribution has various degrees of freedom and is always non-negative, with a slight right skew, especially for smaller degrees of freedom.
- 🔍 The goodness-of-fit test compares observed counts with expected counts, assuming the null hypothesis is true.
- 🎲 An example used is testing if a die is fair, where observed counts of each outcome are compared to expected counts under the assumption of fairness.
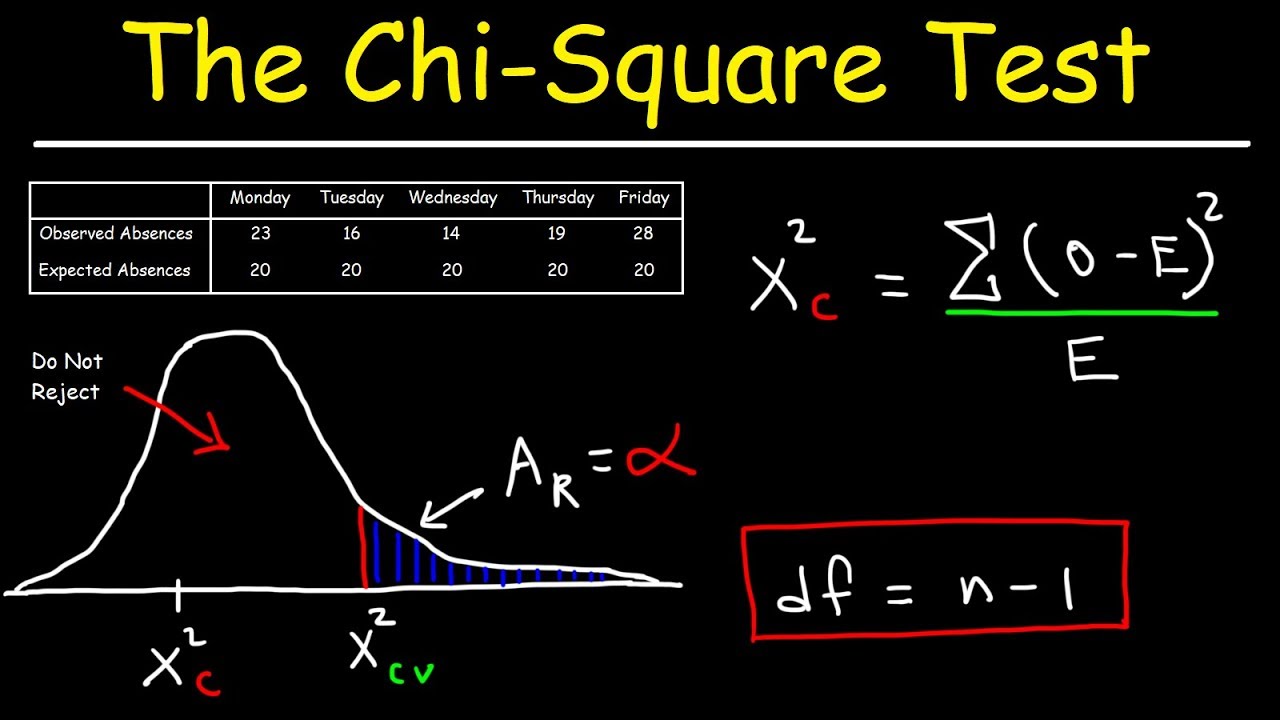
- 📉 The chi-square test statistic formula involves summing the squared differences between observed and expected counts, divided by the expected counts.
- 📉 The degrees of freedom for the chi-square distribution in goodness-of-fit tests is the number of categories minus one.
- 🔍 The hypothesis test steps include defining hypotheses, determining significance level, calculating expected counts, computing test statistics, and deciding based on p-value or critical value method.
Q & A
What is the main topic of the last lesson of the semester?
-The main topic is running a final hypothesis test, specifically a goodness-of-fit test using the chi-square distribution model.
What are t-tests and why are they called so?
-T-tests are hypothesis tests for population means, and they are called t-tests because they rely on the t-distribution to determine p-values.
What are z-tests and why are they used for proportion tests?
-Z-tests are used for testing single or comparing two proportions, and they rely on the standard normal z-distribution to determine probabilities for the test statistic.
What is the chi-square distribution model used for in hypothesis testing?
-The chi-square distribution model is used for testing hypotheses involving qualitative or categorical variables in a goodness-of-fit test.
What is a key feature of the chi-square distribution?
-A key feature of the chi-square distribution is that it is always non-negative, with all values being positive and the distribution being skewed to the right.
How are the expected counts calculated in a goodness-of-fit test?
-The expected counts are calculated by multiplying the total number of trials (n) by the probability (p) for each category, assuming the null hypothesis is true.
What is the formula for the chi-square test statistic in a goodness-of-fit test?
-The chi-square test statistic is calculated as the sum of the squared differences between observed and expected counts, each divided by the expected count for that category.
What is the null hypothesis in a die fairness test?
-The null hypothesis states that the die is fair, meaning that each of the six outcomes has an equal probability of 1/6.
What is the significance of the degrees of freedom in a chi-square test?
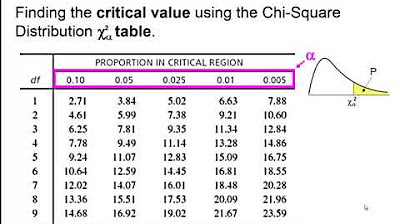
-The degrees of freedom in a chi-square test is determined by the number of categories minus one, and it is used to find the critical value or p-value from the chi-square distribution table.
How do you determine if there is enough evidence to reject the null hypothesis in a chi-square goodness-of-fit test?
-You compare the calculated chi-square test statistic to a critical value from the chi-square distribution table or calculate the p-value and compare it to the significance level (alpha). If the test statistic exceeds the critical value or the p-value is less than alpha, there is enough evidence to reject the null hypothesis.
Outlines
📚 Final Lesson Introduction
The instructor welcomes students to the last lesson of the semester, lesson 23, and introduces a change in the lesson plan. Instead of the usual hypothesis tests for population means or proportions, the focus shifts to a final hypothesis test known as the goodness of fit test. This test utilizes the chi-square distribution model, which is new to the students. The lesson includes a quick review of t-tests and z-tests, explaining their reliance on the t-distribution and standard normal z-distribution respectively. The chi-square test is introduced for qualitative or categorical data, and the instructor promises to delve into the chi-square distribution's characteristics and how it differs from the t-distribution.
📊 Chi-Square Distribution Overview
The instructor provides an overview of the chi-square distribution, highlighting its similarities to and differences from the t-distribution. Key points include the distribution's right skewness, especially with smaller degrees of freedom, and the fact that chi-square values are always non-negative. The lesson explains that the chi-square distribution is used to determine p-values in hypothesis testing. The instructor introduces the concept of degrees of freedom in the context of the chi-square distribution and shows different chi-square distributions for various degrees of freedom. The importance of using a chi-square table or calculator to find critical values or p-values is emphasized.
🎲 Goodness of Fit Test with a Dice Example
The instructor presents a practical example of a goodness of fit test using a dice-rolling scenario. A gambler wants to test if a die is fair by rolling it 60 times and recording the outcomes. The null hypothesis posits that each face of the die has an equal probability of 1/6. The alternate hypothesis suggests that the die is not fair. The instructor explains the process of calculating expected counts based on the null hypothesis and compares them with the observed counts. The chi-square test statistic is introduced as a method to quantify the difference between observed and expected frequencies.
📘 Calculation of Chi-Square Test Statistic
The lesson continues with the dice example, explaining how to calculate the chi-square test statistic. The formula for the test statistic is presented, and the calculation involves taking the squared difference between observed and expected counts, dividing by the expected count, and summing these values across all categories. The degrees of freedom for the test are explained as one less than the number of categories. The instructor emphasizes the importance of ensuring that the sample size is large enough and that the expected counts meet certain conditions for the chi-square test to be valid.
🔢 Chi-Square Test Statistic Computation
The instructor demonstrates the computation of the chi-square test statistic for the dice example. The observed counts for each face of the die are compared with the expected counts, and the differences are squared and weighted by the expected counts. The sum of these values gives the test statistic. The process is illustrated step by step, and the resulting test statistic is used as part of the hypothesis test to determine if there is enough evidence to reject the null hypothesis that the die is fair.
🔍 Hypothesis Testing Template and Decision Making
The instructor outlines the steps involved in a goodness of fit hypothesis test, using a template that includes setting up null and alternate hypotheses, determining the significance level, calculating expected counts, computing the test statistic, and making a decision based on the p-value or critical value. The template is applied to the dice example, with the test statistic being compared to a critical value from the chi-square distribution to decide whether to reject the null hypothesis. The p-value approach and critical value approach are both discussed.
👮♂️ FBI Crime Data Goodness of Fit Test
The lesson moves on to another example involving FBI crime data from 2012, where the proportions of different types of violent crimes in the U.S. are compared to those in California. The null hypothesis is that the proportions in California match the U.S. proportions, while the alternate hypothesis suggests at least one category differs. The instructor guides through the calculation of expected counts based on the U.S. proportions and the sample size of 500 crimes in California. The goodness of fit test is set up to determine if the national distribution is a good fit for California's crime data.
📊 Chi-Square Test Statistic Using Calculator
The instructor explains how to use a calculator program to compute the chi-square test statistic for the FBI crime data example. The program, named 'Chi-square Goftest', is used to input observed and expected counts and calculate the test statistic and its associated probability. The program's steps are detailed, and the resulting test statistic and p-value are used to make a decision regarding the null hypothesis about the crime proportions.
🗳️ Gallup Poll on Abortion Availability
The final example presented is a Gallup poll from May 2013, which surveyed adult Americans on their views regarding the availability of abortion. The poll results are compared with the proportions of people holding these views in 2010. The four categories of opinion are outlined, and the data is set up for a goodness of fit test to determine if the 2010 proportions are a good fit for the 2013 poll results. The null hypothesis posits that the proportions have remained the same, while the alternate hypothesis suggests a change in public opinion.
Mindmap
Keywords
💡Hypothesis Test
💡Goodness of Fit Test
💡Chi-Square Distribution
💡Chi-Square Test Statistic
💡Degrees of Freedom
💡Observed Counts
💡Expected Counts
💡P-Value
💡Critical Value
💡Significance Level (Alpha)
Highlights
Introduction of Lesson 23 focusing on hypothesis testing for goodness of fit using chi-square distribution.
Explanation of t-tests for single or multiple population means based on the t-distribution.
Description of z-tests for single or comparing two proportions using the standard normal z-distribution.
Introduction of chi-square tests for qualitative or categorical data, different from previous t and z-tests.
Overview of the chi-square distribution and its characteristics, including non-symmetry and right skewness.
Presentation of different chi-square distributions for various degrees of freedom and their shapes.
Explanation of the use of chi-square distribution in hypothesis testing to determine p-values.
Demonstration of finding chi-square critical values from a table for specific degrees of freedom and significance levels.
Illustration of the concept of expected counts in the context of hypothesis testing under the null hypothesis.
Procedure for calculating the chi-square test statistic using observed and expected counts.
Requirement of having a large enough sample size to ensure the validity of the chi-square test.
Example of testing a die for fairness by comparing observed rolls to expected outcomes under the null hypothesis of equal probability.
Detailed steps in setting up a goodness of fit hypothesis test including null and alternate hypotheses formulation.
Use of a calculator program to facilitate chi-square goodness of fit test calculations.
Application of the chi-square goodness of fit test to FBI data on violent crimes to compare U.S. proportions to California's.
Gallup poll example assessing public opinion on abortion availability and comparing it to previous years' data.
Emphasis on the right-tailed nature of chi-square goodness of fit tests and the interpretation of p-values in hypothesis testing.
Transcripts
Browse More Related Video
Elementary Statistics - Chapter 11 Chi Square Goodness of Fit Test
Chi Square Test
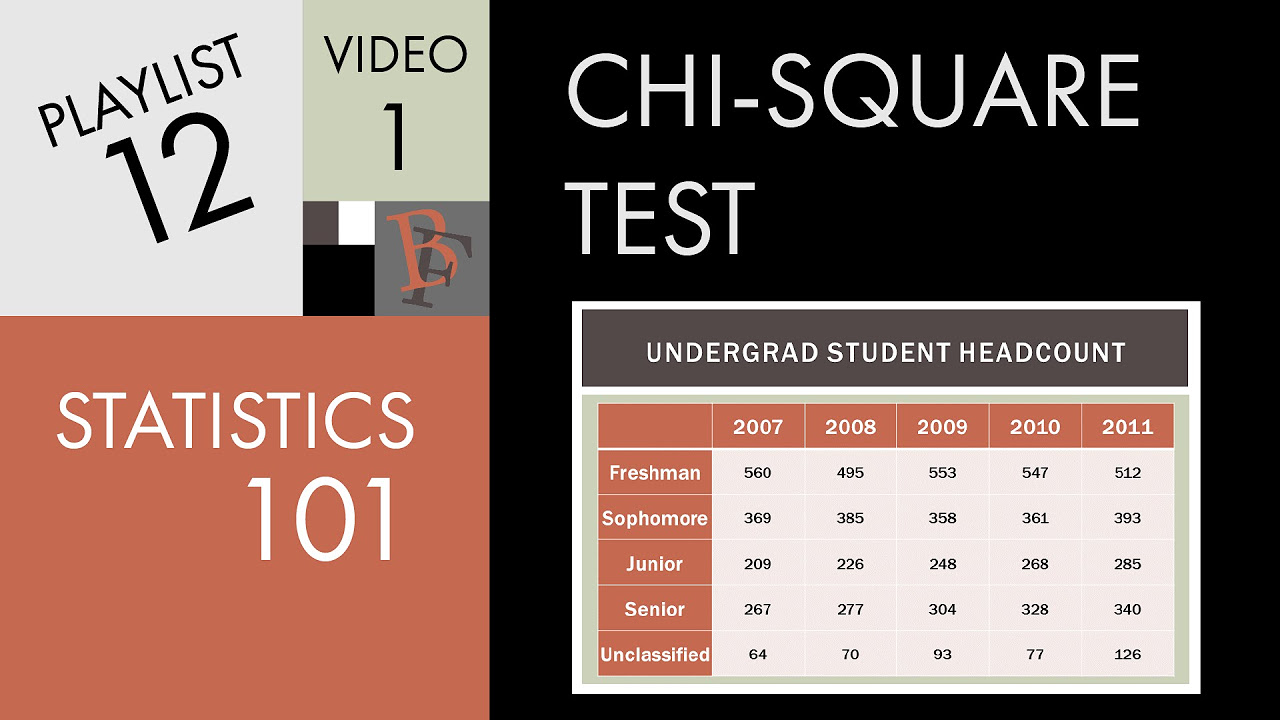
Statistics 101: Introduction to the Chi-square Test

Pearson's chi square test (goodness of fit) | Probability and Statistics | Khan Academy
What is Hypothesis Testing ? Math, Statistics for data science, machine learning
Statistics 101: Chi-square in Excel using College Enrollment Data
5.0 / 5 (0 votes)
Thanks for rating: