P value versus effect size
TLDRThis video introduces 'Stats and Methods Shorts,' a new series focusing on statistical significance versus effect size. It explains that statistical significance measures the likelihood that observed data differences are due to chance, with a p-value < 0.05 typically considered significant. However, effect size is crucial as it quantifies the magnitude of an effect, indicating its practical importance. The video outlines common effect size measures like Pearson's r, r-squared, Cohen's d, and eta squared, emphasizing their importance in understanding the impact of findings, especially in large populations like the U.S.
Takeaways
- 📊 The video introduces a new series called 'Stats and Methods Shorts' aimed at explaining statistical concepts.
- 🔍 It discusses the difference between statistical significance and effect size, emphasizing their importance in data interpretation.
- ⚖️ Statistical significance measures the likelihood that observed data differences are due to chance, not representative of the population.
- 🎲 A p-value is calculated to determine statistical significance, with a common threshold of less than 0.05 indicating significance.
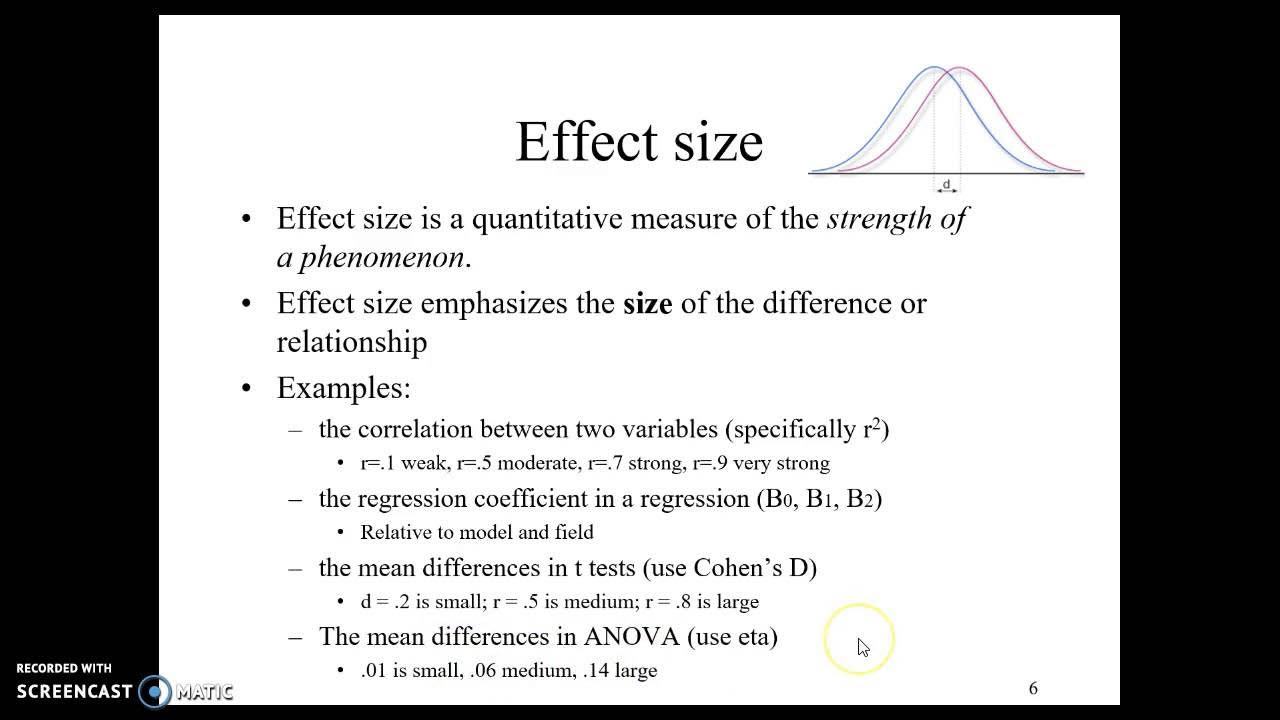
- 📈 Effect size measures the magnitude of an effect and is crucial for understanding the practical impact of findings.
- 🔢 Pearson's r is a correlation coefficient used to measure the strength and direction of a linear relationship between two variables.
- 🧩 R squared (r²) indicates the proportion of total variance explained by the model, giving insight into the model's explanatory power.
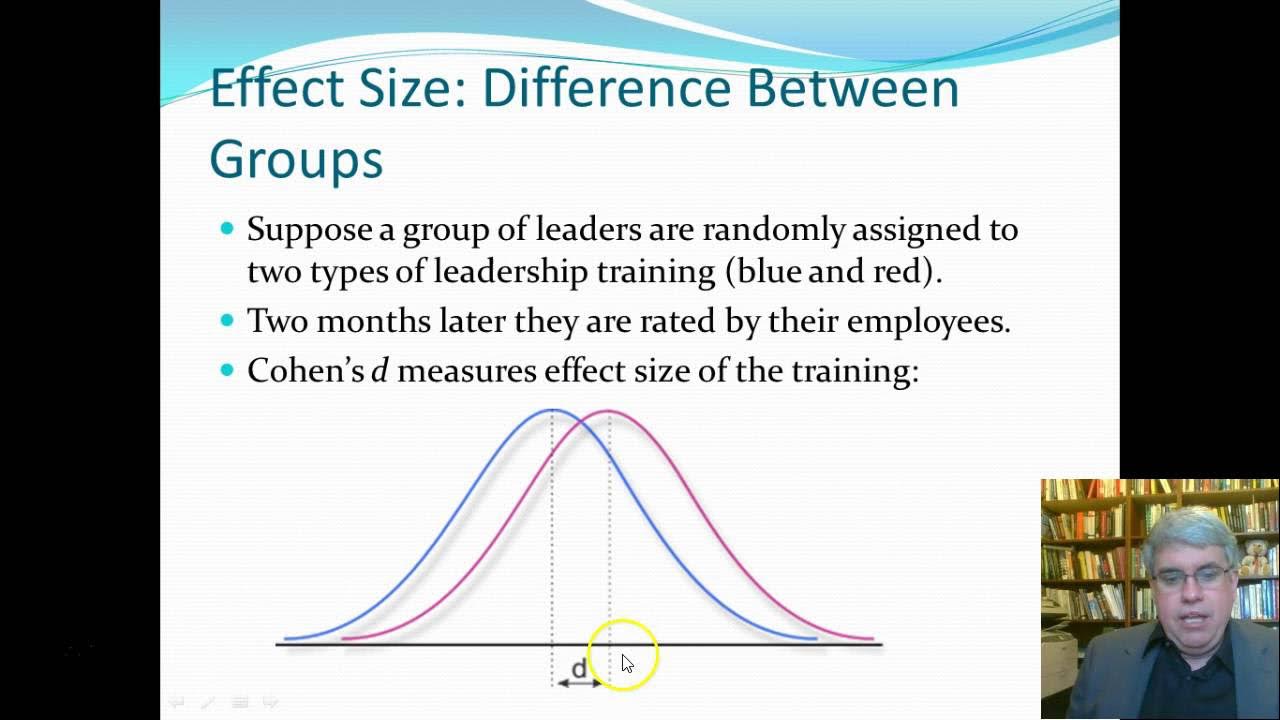
- 🌐 Cohen's d is used for comparing two groups, representing the mean difference as a proportion of pooled variance.
- 📊 Eta squared and partial eta squared are used for comparing more than two groups, showing the proportion of variance explained by group differences.
- 🌟 Even small effect sizes can be meaningful in large populations, as they can still impact a significant number of individuals.
- 🛠 The video encourages viewers to suggest topics for future 'Stats and Methods Shorts' episodes and to engage in the comments section.
Q & A
What is the main focus of the new series 'Stats and Methods Shorts'?
-The new series aims to regularly discuss topics related to statistics and research methods, starting with the distinction between statistical significance and effect size.
What does statistical significance indicate in the context of a study?
-Statistical significance indicates the likelihood that the observed difference in data is not due to chance, with a common threshold of p < 0.05 representing a 95% certainty that the findings are not random.
What is a p-value in statistics?
-A p-value is a probability that the observed findings are due to sampling error, and it is used to determine if the results of a study are statistically significant.
Why is it important to consider effect size in addition to statistical significance?
-Effect size provides a measure of the magnitude of the effect being studied, which is crucial to understand how meaningful or impactful the findings are, beyond just being statistically significant.
What is Pearson's r and how does it relate to effect size?
-Pearson's r is a correlation coefficient that ranges from -1 to 1, indicating the strength and direction of the relationship between two variables. While it shows the association, it does not directly indicate how much variability is explained by the correlation.
How is r squared calculated and what does it represent?
-R squared is calculated by squaring Pearson's r for simple correlations or through a different method for complex models. It represents the percentage of total variance that the model explains.
What is Cohen's d and how is it used?
-Cohen's d is a measure of effect size that signifies the mean difference between two groups as a proportion of their pooled variance, often used when comparing just two groups.
What are eta squared and partial eta squared, and when are they used?
-Eta squared and partial eta squared are measures of effect size used when comparing more than two groups. They represent the proportion of total variance in the outcome of interest that is explained by the differences between the groups.
Why might a small effect size still be meaningful in a large population?
-A small effect size can still be meaningful if the population is large, as even a small percentage improvement can translate to a significant number of people benefiting from the effect.
How can a small effect size be significant in a real-world application?
-A small effect size can be significant if the intervention or treatment is inexpensive and easily accessible, allowing it to be applied to a large population, thereby helping a substantial number of people.
What does the speaker encourage the audience to do at the end of the transcript?
-The speaker encourages the audience to like, share, and subscribe to the channel, and to provide suggestions for future topics or to share more thoughts on the discussed topic in the comments section.
Why is it essential to measure both statistical significance and effect size in a study?
-Both statistical significance and effect size are essential because statistical significance tells us if the findings are likely not due to chance, while effect size tells us how large or meaningful the observed effect is, allowing for a more comprehensive understanding of the study's outcomes.
Outlines
📊 Understanding Statistical Significance and Effect Size
The video script introduces a new series called 'Stats and Methods Shorts' aimed at discussing important statistical concepts. The first topic is the distinction between statistical significance and effect size. Statistical significance is the probability that observed data differences are not due to chance, with a common threshold of p < 0.05 indicating a 95% confidence that the findings are not random. Effect size, on the other hand, measures the magnitude of the effect and its importance. The script explains different measures of effect size, including Pearson's r for correlation strength, r squared for the proportion of variance explained by the model, Cohen's d for the mean difference between two groups in terms of standard deviation, and eta squared and partial eta squared for the proportion of variance explained by group differences. The video emphasizes that even small effect sizes can be significant when applied to large populations, using the example of a treatment that benefits a small percentage of the U.S. population but still impacts millions due to the sheer size of the population.
Mindmap
Keywords
💡Statistical Significance
💡Effect Size
💡Sampling Error
💡P-Value
💡Pearson's R
💡R Squared
💡Cohen's D
💡Eta Squared
💡Partial Eta Squared
💡Population
Highlights
Introducing a new series called 'Stats and Methods Shorts' on the channel.
Discussing the difference between statistical significance and effect size.
Statistical significance is the likelihood that observed data differences are due to chance.
Sampling error can affect the representativeness of a study's sample.
P-value is a measure of the probability that a finding is due to sampling error.
A p-value less than 0.05 is generally considered statistically significant.
Effect size measures the magnitude of an effect and its importance.
Pearson's r is a correlation coefficient ranging from -1 to 1, indicating the strength of a relationship.
R squared represents the percentage of total variance explained by the model.
Cohen's d is used to measure the mean difference between two groups as a proportion of their pooled variance.
Eta squared and partial eta squared are used for comparing more than two groups.
Even small effect sizes can be meaningful in large populations.
An example given is a new treatment that helps a small percentage of the U.S. population but is accessible and affordable.
The importance of considering both statistical significance and practical implications.
Invitation for viewers to like, share, subscribe, and suggest topics for future videos.
Encouraging comments and further discussion on the topic.
Transcripts
Browse More Related Video
5.0 / 5 (0 votes)
Thanks for rating:


