Power Analysis
TLDRThis lecture delves into the concept of statistical power analysis, a crucial yet underutilized tool in inferential statistics. It explains the meaning of statistical power—the probability of detecting a true effect—and outlines the key components: sample size, effect size, alpha, and beta. The lecture also covers the importance of addressing both Type I and Type II errors and provides practical purposes for conducting power analysis, such as determining necessary sample size or minimal detectable effect size. It concludes with an overview of various tools and techniques, including G*Power, Optimal Design, R packages, and Mplus, to aid in power analysis.
Takeaways
- 🧮 **Statistical Power Definition**: Statistical power is the probability of correctly rejecting the null hypothesis when it is false, indicating the ability to detect a true effect or association in the population.
- 🔍 **Purpose of Power Analysis**: Power analysis is used to determine the probability that a study can detect an effect if there is one, and it helps in planning the study size and design.
- 📊 **Components of Power Analysis**: Key components include sample size (n), effect size, alpha level, and power (1-beta), where at least three are needed to estimate the fourth.
- 🚫 **Type 1 and Type 2 Errors**: Type 1 error is the incorrect rejection of a true null hypothesis (false positive), while Type 2 error is the failure to reject a false null hypothesis (false negative).
- ⚖️ **Balance Between Errors**: There's a trade-off between Type 1 and Type 2 errors; reducing one often affects the other, as they are linked through the alpha and beta levels.
- 📈 **Sample Size and Power**: Larger sample sizes generally lead to higher statistical power and less variation, making it easier to detect true effects.
- 🔑 **Importance of Addressing Type 2 Error**: Historically, focus was on Type 1 errors, but there is now an equal emphasis on Type 2 errors to ensure meaningful relationships in the population are not missed.
- 📝 **Practical Applications of Power Analysis**: It's used to determine necessary sample size before data collection, estimate the minimally detectable effect size, and assess if a study was adequately powered after data collection.
- 🛠️ **Tools for Power Analysis**: Various tools like G*Power, Optimal Design, R packages (pwr, bmem), and Mplus Impus are available for conducting power analysis, each with different strengths and applications.
- 📉 **Effect of Effect Size**: The larger the effect size, the smaller the sample size needed to achieve adequate power, which is crucial for planning research studies.
- ✅ **Adequate Power Convention**: A common convention for sufficient statistical power is 0.80 or higher, which indicates a good chance of detecting a true effect if it exists.
Q & A
What is statistical power in the context of inferential statistics?
-Statistical power refers to the probability of detecting a true association or difference in the underlying population with a particular analysis or design. It's the ability to find an effect that actually exists.
What is the purpose of conducting a power analysis?
-The purpose of a power analysis is to determine the probability of an analysis or design's ability to detect a true association or difference in the underlying population. It helps in planning the study to ensure it has a good chance of detecting an effect if it exists.
What are the four components of statistical power?
-The four components of statistical power are sample size (n), effect size (such as Cohen's d, correlation coefficient, or R-squared value), alpha (the significance level), and power (represented by 1 - beta).
What is the relationship between alpha and beta in statistical power analysis?
-Alpha is related to Type 1 error and is set as the threshold for p-value significance, commonly at 0.05 for a two-tailed test. Beta is related to Type 2 error, and power is represented as 1 - beta. There's a trade-off between alpha and beta; decreasing one generally increases the other.
What is Type 1 error in statistical decision making?
-Type 1 error occurs when the null hypothesis is true in the population (meaning there is no effect or difference), but the sample data leads to the rejection of the null hypothesis, falsely concluding that there is an effect or difference.
What is Type 2 error in statistical decision making?
-Type 2 error happens when the null hypothesis is false in the population (meaning there is an effect or difference), but the sample data leads to failing to reject the null hypothesis, thus failing to detect the actual effect or difference.
Why is addressing Type 2 error important in research?
-Addressing Type 2 error is important because it represents the risk of failing to detect a true effect or difference in the population. This can lead to incorrect conclusions and missed opportunities for valid findings.
What are the three general purposes for conducting a power analysis?
-The three general purposes for conducting a power analysis are: 1) to determine the necessary sample size to achieve sufficient statistical power before collecting data, 2) to determine the minimally detectable effect size for a range of different sample sizes before collecting data, and 3) to determine if the design or analysis had sufficient power to detect relationships after collecting data.
What is G*Power and how can it be used for power analysis?
-G*Power is a free, user-friendly software that helps in statistical power analysis. It can be used to determine the required sample size, effect size, or power for various statistical tests and designs.
What are some tools and platforms available for conducting power analysis?
-Some tools and platforms for power analysis include G*Power, Optimal Design, R packages like 'pwr' and 'bmem', and Mplus Impute. These tools cater to different types of analyses and can be used for both simple and complex designs.
Outlines
🔍 Introduction to Power Analysis in Statistics
The lecture begins with an introduction to power analysis, a critical yet underutilized tool in inferential statistics. Power analysis is defined as the probability of detecting a true association or difference in the population when it exists. The concept of statistical power is explored, which is the ability of a study to find an effect that is actually there. Four key components are identified: sample size (n), effect size (such as Cohen's d or r-squared), alpha level, and beta (error type 2). The lecture explains the importance of knowing at least three of these components to estimate the fourth. It also introduces the concepts of type 1 and type 2 errors, providing a foundational understanding of power analysis and its role in research design.
📊 Understanding Type 1 and Type 2 Errors in Statistical Decisions
This section delves deeper into the implications of type 1 and type 2 errors within the context of statistical decision-making. Type 1 error, represented by alpha, is the incorrect rejection of a true null hypothesis, whereas type 2 error, represented by beta, is the failure to reject a false null hypothesis. A visual aid in the form of a table is introduced to illustrate the outcomes of these errors. The lecture explains the trade-off between these errors and how adjusting one affects the other. It also discusses the historical focus on type 1 error and the growing concern over type 2 error in recent years, emphasizing the importance of having adequately powered studies to detect true effects.
📚 The Importance of Addressing Type 2 Error and Power Analysis
The lecture continues by discussing the importance of addressing type 2 error and the role of power analysis in ensuring that studies are adequately powered to detect true effects. It highlights the historical focus on type 1 error and the shift towards a more balanced view that includes type 2 error. The speaker recommends further reading on the topic, including articles by Jacob Cohen, to gain a deeper understanding of power analysis. The section also introduces the concept of statistical power as a measure to detect true effects, with a focus on minimizing type 1 and type 2 errors while maintaining a balance between them.
📉 Practical Applications of Power Analysis in Research
This part of the lecture focuses on the practical applications of power analysis in research. Three general purposes for conducting a power analysis are outlined: determining the necessary sample size before data collection, estimating the minimally detectable effect size for different sample sizes, and assessing whether a study had sufficient power after data collection. The speaker explains the 'knowns' and 'unknowns' in each scenario, such as setting alpha and power levels, and the need to estimate effect sizes. The section provides a clear framework for researchers to apply power analysis in their work to ensure robust and reliable studies.
🛠 Tools and Techniques for Conducting Power Analysis
The lecture concludes with an overview of various tools and techniques available for conducting power analysis. The speaker mentions several platforms and packages, including G*Power, Optimal Design, and R packages like 'pwr' and 'bmim'. Each tool is briefly explained, along with its specific use cases, such as G*Power for general power analysis and 'bmim' for mediation models. The section also highlights the importance of accurate input, as 'garbage in, garbage out' applies to power analysis, emphasizing the need for careful estimation of effect sizes and other parameters.
🔚 Summary of Power Analysis and its Significance in Research
In the final summary, the lecture recaps the key points about statistical power and power analysis. It emphasizes the importance of power analysis in detecting true effects in the population and the three general purposes for its use: a priori planning, determining effect sizes, and post hoc assessment of study power. The speaker also reviews the tools and techniques mentioned earlier, reinforcing their utility in estimating statistical power. The lecture concludes by reiterating the significance of power analysis in ensuring that research is well-equipped to identify and validate true associations or differences.
Mindmap
Keywords
💡Statistical Power
💡Power Analysis
💡Sample Size (n)
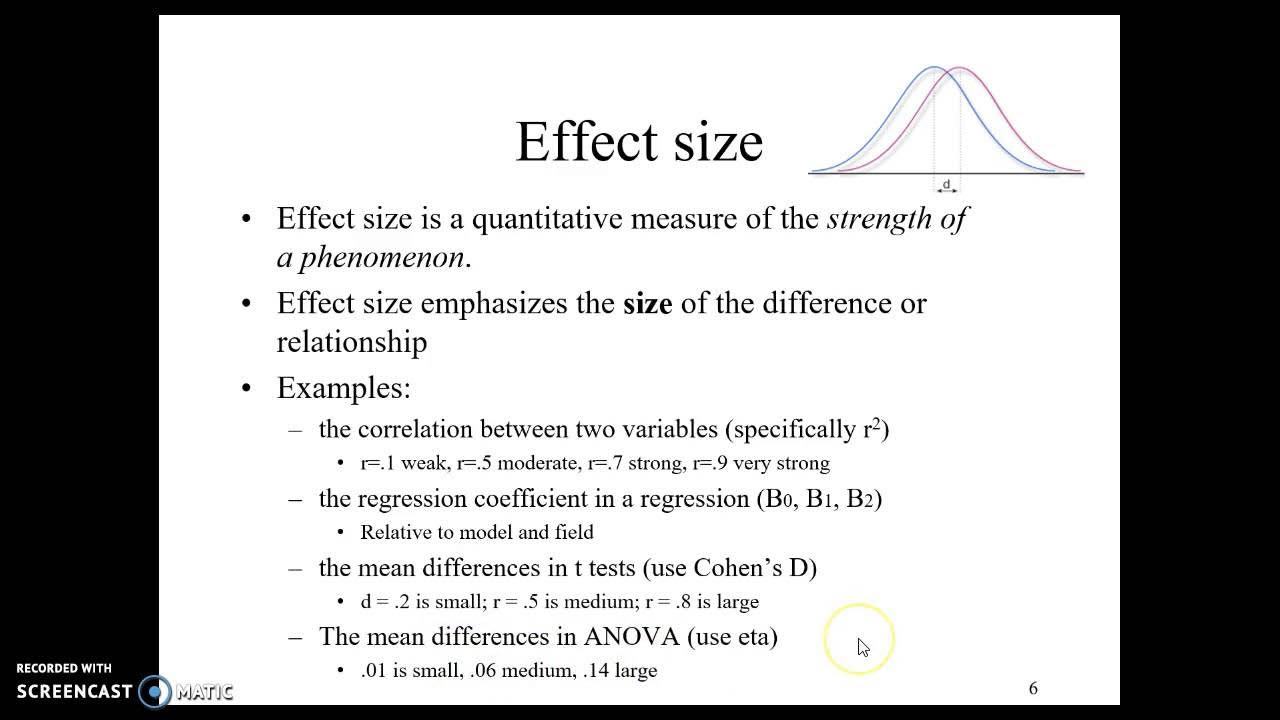
💡Effect Size
💡Alpha (α)
💡Type I Error
💡Type II Error
💡Beta (β)
💡Critical Value
💡Minimally Detectable Effect Size (MDES)
💡Underpowered Study
💡Tools for Power Analysis
Highlights
Power analysis is an important tool in inferential statistics for determining the probability to detect a true association or difference in the population.
Statistical power is influenced by four main components: sample size, effect size, alpha, and beta.
Power analysis can be used to estimate one unknown element when three out of the four components are known.
Type 1 error corresponds to the alpha level set and is about the threshold for p-value significance.
Type 2 error is related to beta and power, and power analysis helps address this error while considering the impact on Type 1 error.
Understanding Type 1 and Type 2 errors is crucial for making correct statistical decisions based on sample findings and population truth.
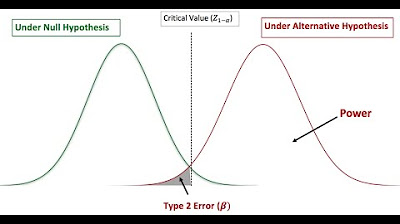
The balance between Type 1 and Type 2 errors is depicted through sampling distributions and critical values.
Increasing alpha decreases beta, and vice versa, showing the trade-off between Type 1 and Type 2 errors.
The importance of addressing Type 2 error has grown in recent decades to ensure adequately powered studies.
Three general purposes for conducting a power analysis include determining necessary sample size, minimally detectable effect size, and post hoc evaluation of study power.
G*Power is a user-friendly, free tool for power analysis with documentation available in behavioral research methods.
Optimal Design is another free tool suitable for experimental designs, randomized trials, and meta-analyses.
The R package 'pwr' is useful for common statistical tests and has comprehensive documentation.
The 'bmem' R package uses Monte Carlo simulations for more complex designs like mediation analyses.
Mplus is a paid package that offers advanced power analysis for complex models, including multi-level frameworks.
Effect size estimation is crucial for power analysis, and inaccurate estimation can lead to misleading results.
The lecture concludes by emphasizing the importance of power analysis in ensuring the ability to detect true effects in the population.
Transcripts


5.0 / 5 (0 votes)
Thanks for rating: