Choosing a Statistical Test
TLDRThis script offers a guide for healthcare researchers on selecting the appropriate hypothesis test for their studies. It emphasizes the importance of choosing the right test early in the research design, as it directly relates to the type of data collected. The transcript breaks down the decision-making process into three key questions: the type of data (categorical or quantitative), the number of samples or groups involved, and the purpose of the test (comparison or relationship). It then categorizes common tests accordingly and explains the scenarios in which each test is suitable, such as t-tests for mean comparison and chi-square for categorical data analysis.
Takeaways
- 🔍 Hypothesis tests are crucial in healthcare quantitative research and should be chosen based on the study design and data type.
- 📊 The choice of hypothesis test is directly related to the type of data collected, which can be either categorical or quantitative.
- 📈 Quantitative data includes measurements like height, weight, blood pressure, and ratings on a scale, while categorical data involves counting subjects with specific traits.
- 📝 Categorical data often involves calculating proportions or rates, such as patient fall rates or mortality rates.
- 🧐 When categorizing tests, it's important to consider if the data is categorical or quantitative and the number of samples or groups involved in the study.
- 👥 The number of samples can range from one sample to two samples, two samples special (paired), or three or more samples.
- 🧐 Two samples special refers to situations where you have two sets of data from the same group of people, such as before and after measurements.
- 🔬 The hypothesis test's purpose can be either to compare data between groups or to a historical value, or to seek a relationship between two sets of data.
- 📉 For one sample and categorical data, a one sample proportion test is used, while for two samples, a two sample proportion test is appropriate.
- 📊 When dealing with quantitative data and two samples special, a paired t-test is used to compare the changes or differences between the two measurements.
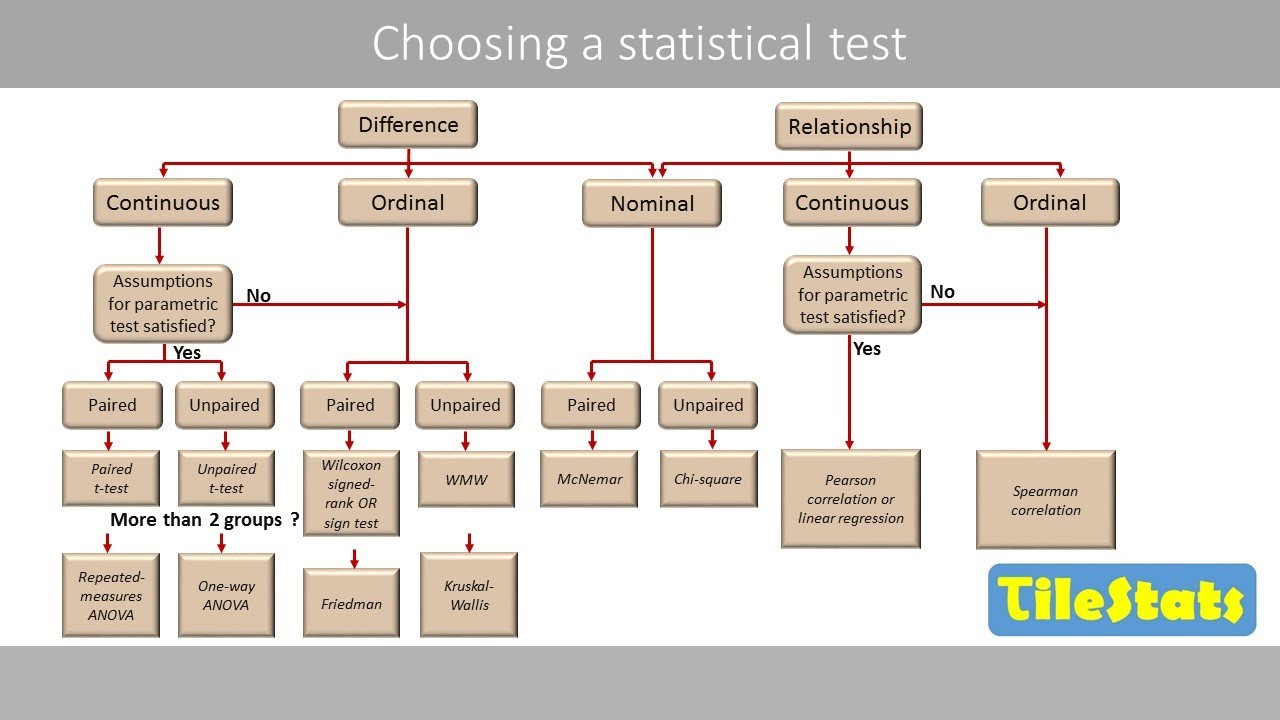
- 🔍 To determine the appropriate test, researchers should ask three key questions: the type of data collected, the number of samples, and the purpose of the hypothesis test.
Q & A
Why is it crucial to choose the right hypothesis test at the beginning of a healthcare study design?
-Choosing the right hypothesis test at the beginning is crucial because the type of test directly relates to the data being collected. It ensures that the collected data can be effectively used to test the hypotheses, preventing the waste of resources on a study that yields unusable data.
What are the two main classes of data that can be collected in healthcare research?
-The two main classes of data are categorical and quantitative. Categorical data are labels or categories, while quantitative data are measurements such as height, weight, blood pressure, and ratings on scales.
Can you provide an example of categorical data in healthcare research?
-An example of categorical data is asking patients if they have a family history of heart disease, where the answers are 'yes' or 'no', which are categories.
What is the difference between counting categorical data and collecting quantitative data?
-Counting categorical data involves tallying the number of subjects who fall into specific categories, like 'yes' or 'no' responses. In contrast, collecting quantitative data involves measuring variables like the number of siblings someone has, where each individual can have a different numerical value.
Why are rates considered categorical data in healthcare?
-Rates, such as patient fall rates or mortality rates, are considered categorical data because they represent proportions of outcomes (like yes/no, die/survive) rather than actual measurements or counts of individual subjects.
What is the significance of determining whether you have one sample or multiple samples in a healthcare study?
-Determining the number of samples is significant because it influences the choice of hypothesis test. Different tests are suited for single-sample comparisons, two-sample comparisons, or comparisons involving three or more samples.
Can you explain the concept of 'two samples special' in the context of healthcare research?
-'Two samples special' refers to situations where you have two sets of data from the same group of people, such as before-and-after measurements. These are treated as two separate samples because they represent different data points from the same subjects.
What is the purpose of a one-sample proportion test in healthcare research?
-A one-sample proportion test is used when you have categorical data from a single sample and you want to compare the proportion of subjects with a particular characteristic to a known proportion or historical value.
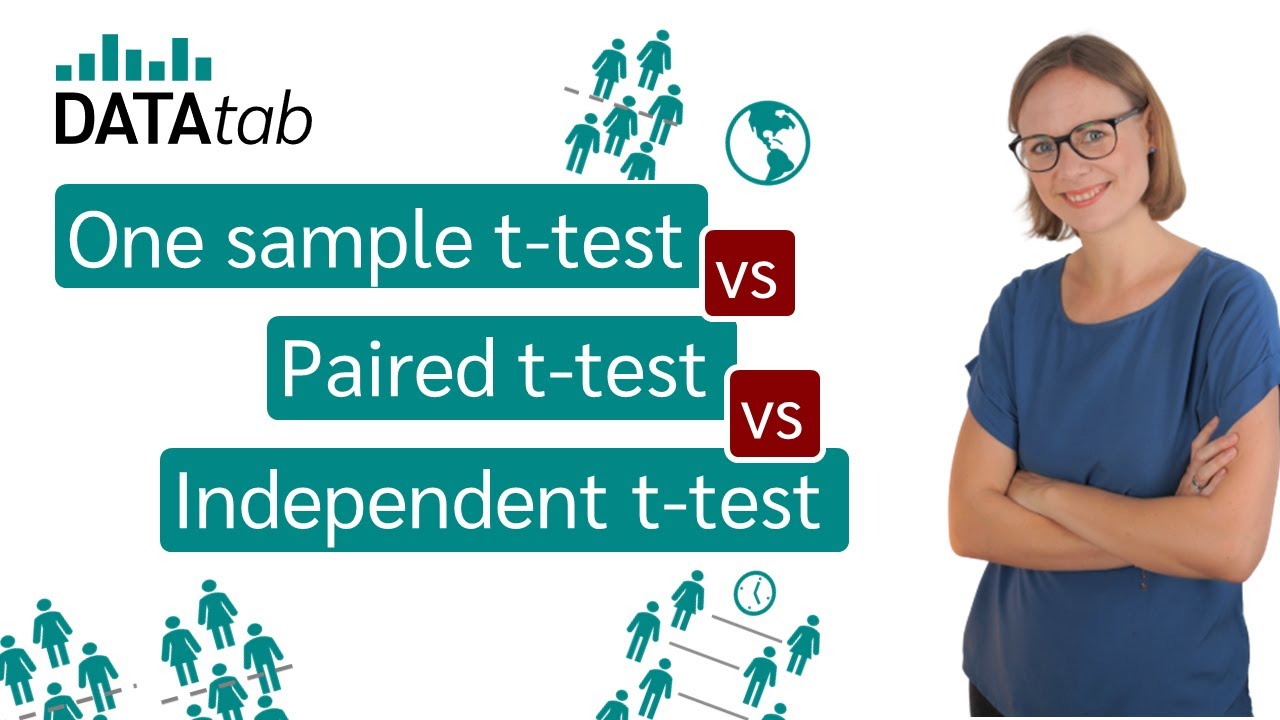
How does a paired t-test differ from a two-sample t-test in analyzing healthcare data?
-A paired t-test is used when you have two measurements from the same subjects (two samples special) and you want to compare the changes or differences between the two sets of measurements. A two-sample t-test, on the other hand, compares the means of two separate, unrelated groups without considering any pairing.
What is the primary goal of a correlation and regression analysis in healthcare research?
-The primary goal of correlation and regression analysis is to explore the relationship or trend between two sets of quantitative data, such as determining if there is a link between a mother's bone density and her age.
How can the three key questions help in selecting the appropriate hypothesis test for a healthcare study?
-The three key questions help in identifying the type of data, the number of samples, and the research objective (comparison or relationship). Answering these questions guides you to the appropriate hypothesis test that fits the study's design and purpose.
Outlines
🔍 Choosing the Right Hypothesis Test for Healthcare Research
This paragraph discusses the importance of selecting the appropriate hypothesis test at the beginning of a healthcare study. It emphasizes that the type of test is directly related to the data being collected and highlights the consequences of choosing the wrong test. The speaker provides a list of common tests used in healthcare research, categorizing them into two main groups: categorical and quantitative data tests. The paragraph also introduces three key questions that researchers should ask themselves to determine the most suitable test: the type of data planned for collection, the number of samples or groups involved, and whether the study is comparing data or seeking a relationship between data sets.
📊 Understanding Data Types and Sample Groups in Research Design
The second paragraph delves deeper into the distinction between categorical and quantitative data, providing examples of each and explaining how they are used in healthcare research. It also discusses the concept of 'two samples special', where two measurements are taken from the same group of people, and the importance of understanding whether the research involves one sample, two samples, or more. The paragraph further explains how these factors influence the choice of statistical tests, such as one-sample or two-sample proportion tests for categorical data, and t-tests or ANOVA for quantitative data, depending on the number of samples and the nature of the data.
📚 Deciding Between Two-Sample T-Test and Paired T-Test
The final paragraph focuses on the decision between using a two-sample T-test and a paired T-test when dealing with quantitative data and two samples that are 'special', meaning they are derived from the same group of subjects. It explains that a two-sample T-test treats the data as if it came from separate groups, while a paired T-test considers the relationship between the two sets of data, such as before-and-after measurements. The paragraph clarifies that a paired T-test is used to determine the average change in measurements for each individual, providing a more detailed analysis of the data. The speaker concludes by reiterating the importance of asking the three key questions to identify the correct hypothesis test for a given research study.
Mindmap
Keywords
💡Hypothesis Test
💡Quantitative Research
💡Categorical Data
💡Quantitative Data
💡Rates
💡Sample
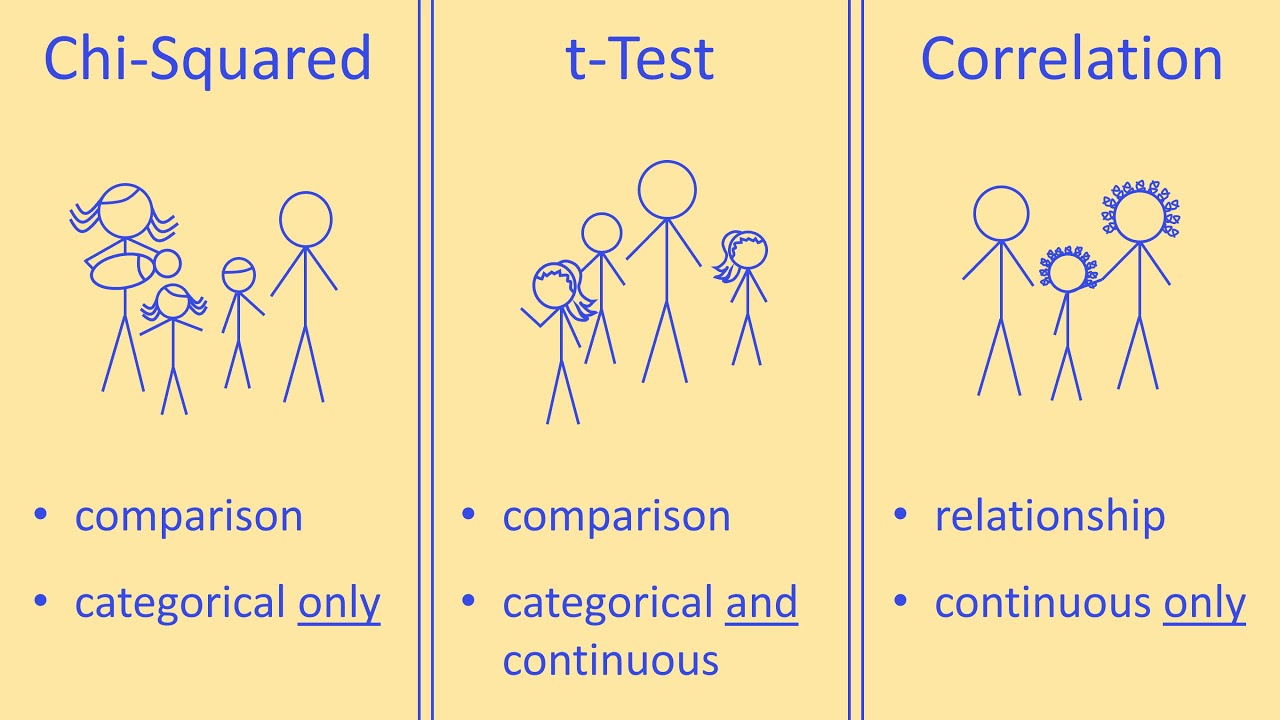
💡T-test
💡ANOVA
💡Correlation and Regression
💡Chi-Square Test
💡Proportions
Highlights
The importance of selecting the appropriate hypothesis test at the beginning of designing a healthcare study.
The relationship between the type of hypothesis test and the data being collected.
The distinction between categorical and quantitative data in healthcare research.
Quantitative data typically includes measurements such as height, weight, and blood pressure.
Categorical data involves counting responses within categories and determining proportions.
The concept of 'two samples special' where two sets of data are collected from the same group.
The need to differentiate between comparing data and seeking a relationship between data sets.
The use of one sample proportion test for categorical data with a single sample.
Two sample proportion test for categorical data with two separate samples.
Chi-square test for categorical data with more than two samples.
T-test and ANOVA for comparing means in quantitative data with two or more samples.
Correlation and regression for seeking relationships and trends in quantitative data.
The difference between a two sample T-test and a paired T-test for quantitative data.
Paired T-test's focus on the difference between two measurements from the same subjects.
The process of determining the correct hypothesis test by asking three key questions.
The practical application of hypothesis testing in healthcare research to avoid unusable data.
The necessity to understand the nature of the data and the research questions before selecting a test.
Transcripts
Browse More Related Video
Choosing a Statistical Test for Your IB Biology IA
How to choose an appropriate statistical test
Statistical Tests: Choosing which statistical test to use

Elementary Statistics - Chapter 9 - Inferences from Two Samples

Quantitative Data Analysis 101 Tutorial: Descriptive vs Inferential Statistics (With Examples)
One sample t-test vs Independent t-test vs Paired t-test
5.0 / 5 (0 votes)
Thanks for rating: