Chi-Square Tests: Crash Course Statistics #29
TLDRIn this episode of Crash Course Statistics, Adriene Hill delves into the world of categorical variables and their fit with statistical models, using the chi-square test as the primary tool. Through the engaging example of the video game League of Lemurs, viewers learn how to compare observed frequencies with expected frequencies to determine statistical significance. The episode explores the chi-square test in three main applications: Goodness of Fit, Test of Independence, and Test of Homogeneity, using real-world examples like Hogwarts House preferences and pineapple on pizza. This approach simplifies complex statistical concepts, making them accessible and relatable to a broad audience.
Takeaways
- 😀 Frequency tables help visualize distribution of categorical variables
- 😎 Chi-square tests measure fit between observed and expected frequencies
- 📊 Goodness-of-fit tests compare one categorical variable distribution to expected
- 🔢 Degrees of freedom = number of categories - 1
- 🧮 Expected frequencies help calculate chi-square statistic
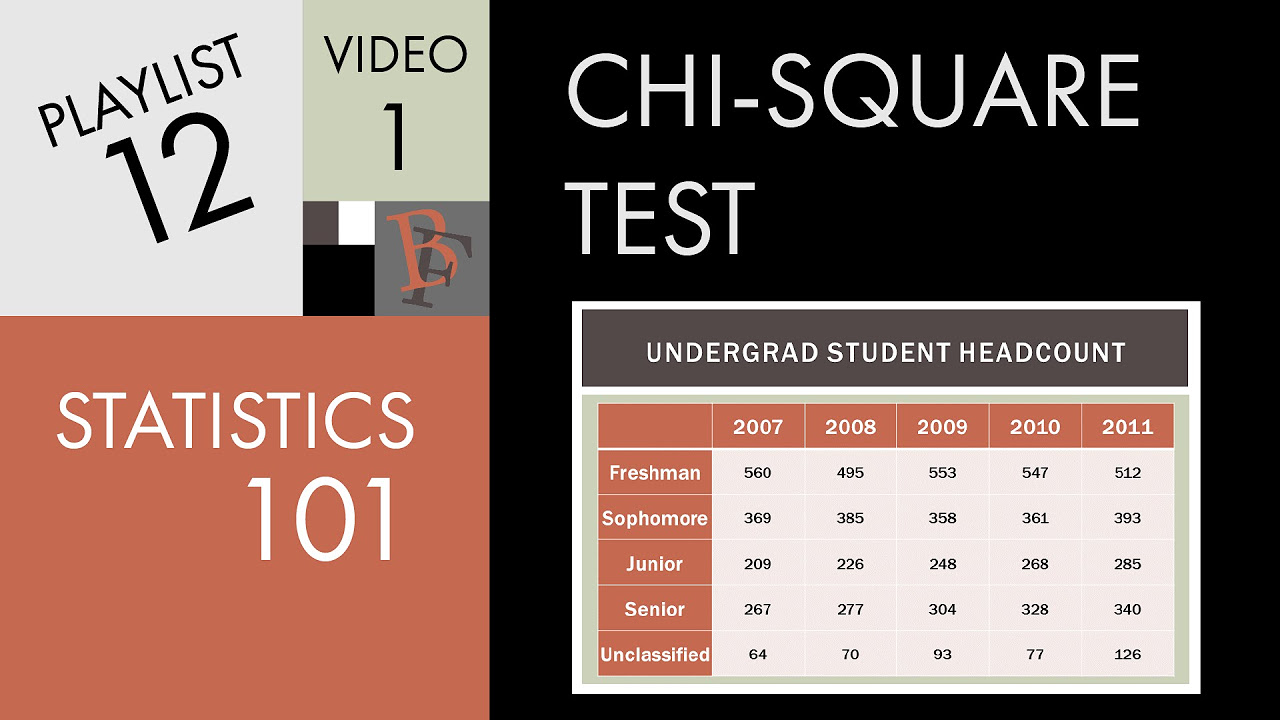
- 👩🏫 Homogeneity tests compare distribution of categories across samples
- 🤝 Independence tests relationships between two categorical variables
- 🦄 NerdFighter survey looks at preferences by Hogwarts house
- 🍍 No evidence that house depends on pineapple pizza preference
- ✅ Checking model fit helps test assumptions about populations
Q & A
What is a frequency table and what information does it provide?
-A frequency table shows the counts or frequencies of different categories. For example, a frequency table could show the number of people who chose each Hogwarts house in the Nerdfighteria survey.
What are the three main types of chi-square tests?
-The three main types of chi-square tests are: 1) Goodness of Fit, which tests how well the observed frequencies fit expected frequencies, 2) Test of Independence, which tests if two categorical variables are independent, and 3) Test of Homogeneity, which tests if different samples are likely from the same population.
Why do we use expected frequencies in the chi-square formula?
-We use expected frequencies in the denominator of the chi-square formula to account for the fact that a difference of 1 between observed and expected counts matters more when the expected count is small than when it is large. Using expected frequencies helps standardize the differences.
What is the null hypothesis being tested in the Nerdfighteria survey example?
-The null hypothesis is that the distribution of Hogwarts House is the same for both pineapple lovers and haters - in other words, that liking pineapple on pizza is independent of Hogwarts House.
How do you calculate expected frequencies for a chi-square test of independence?
-To calculate expected frequencies, take the row total and column total for that cell and divide them by the overall total. This gives the expected frequency if the variables are independent.
Why must expected frequencies be greater than 5 for the chi-square test results to be valid?
-If expected frequencies are less than 5, the chi-square approximation may be inaccurate. The value of 5 is an arbitrary cutoff, but it is widely accepted.
What are degrees of freedom in a chi-square test and how are they calculated?
-Degrees of freedom refer to the number of independent pieces of information. For a chi-square test of independence, the degrees of freedom is calculated as (number of rows - 1) x (number of columns - 1).
What would lead you to reject the null hypothesis in a chi-square test?
-You would reject the null hypothesis if your p-value is less than the chosen significance level, usually 0.05. This indicates the observed data differs significantly from the expected data under the null hypothesis.
How could a chi-square test be useful for comparing distributions of categorical variables?
-A chi-square goodness-of-fit test could be used to compare an observed distribution of a categorical variable to an expected distribution. For example, you could test if the observed distribution of Skittles colors matches the claimed distribution.
What is the difference between a test of independence and a test of homogeneity using chi-square?
-A test of independence looks at whether two categorical variables are related, while a test of homogeneity looks at whether two samples are likely to have come from the same population distribution.
Outlines
😃 Introducing Chi-Square Tests for Categorical Variables
This paragraph introduces chi-square tests which help assess the fit between observed data and expected frequencies for categorical variables. It explains how chi-square tests are similar to other statistical tests but use a different formula. An example is provided analyzing character choices in a video game.
😊 Three Types of Chi-Square Tests and Example with Nerdfighters Data
This paragraph describes the three main types of chi-square tests - goodness of fit, test of independence, and test of homogeneity. It provides an example analyzing whether Hogwarts house preference is related to liking pineapple on pizza using Nerdfighters survey data.
🧐 Chi-Square Tests Help Check Assumptions About Categories
This concluding paragraph notes that chi-square tests are useful for checking assumptions and relationships between categorical variables, like colors of Skittles or pet ownership and political affiliation.
Mindmap
Keywords
💡Frequency table
💡Null hypothesis
💡Chi-square test
💡Goodness of fit
💡Test of independence
💡Test statistic
💡Degrees of freedom
💡p-value
💡Expected frequency
💡Statistical significance
Highlights
Statistics are the same. You want to make sure your models or preconceptions are a good fit for the data you have.
The test we’ll use here -- Chi Square -- is only slightly different from the others we’ve used so far.
Using a chi-square, we square them before adding them all up.
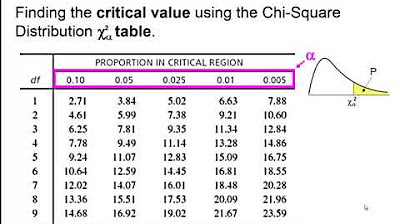
In this case, our degrees of freedom is the number of categories we have, 4 minus 1.
All Chi-square tests follow the same formula we just worked through.
One way to know that you’re looking at a Goodness Of Fit Chi-square test is if it only has one row.
But chi-square tests aren’t limited to analyzing just ONE categorical variable. They can even handle TWO.
In essence they’re testing similar things, and the calculations we’re about to do are the same for both tests.
We already know that there’s 1000 total people, and we can count up all the people who don’t like pineapple on their pizza to find that there’s 479 of them
In general the formula for degrees of freedom for these chi-square tests is rows minus 1, times columns minus 1.
Remember, the expected counts are what we would expect if the null hypothesis is true.
Once we have our expected frequency, we just need to use our Chi-square formula on each cell, and add them all up to get our Chi-Square Statistic:
If the null were true, we’d expect to see numbers as or more different than ours 60% of the time.
Whether that’s testing whether a population is distributed the way we think it is. Are there really the same proportion of Skittles colors in a bag?
Since we, as humans, tend to categorize many things, from dog breed to hair color, it can be useful to check what we think about how and if those categories interact.
Transcripts
Browse More Related Video
Elementary Statistics - Chapter 11 Chi Square Goodness of Fit Test

AP Statistics Unit 8 Chi Square Tests Summary Review Video

Elementary Statistics Lesson #23A
Statistics 101: Introduction to the Chi-square Test

Chi-square distribution introduction | Probability and Statistics | Khan Academy
ANOVA: Crash Course Statistics #33
5.0 / 5 (0 votes)
Thanks for rating: