Statistics 101: One-way ANOVA, A Visual Tutorial
TLDRThis video tutorial offers an in-depth introduction to one-way ANOVA, a statistical method for comparing the means of more than two groups. The host begins by encouraging viewers to stay positive and engaged, then outlines the video's structure, which includes conceptual background and practical application using Microsoft Excel. The script explains the limitations of previous methods and the advantages of ANOVA, which allows for the comparison of multiple populations or subgroups. An example involving student study skills at the Autonomous University of Madrid illustrates the process, with a focus on calculating means, understanding variance, and partitioning the sum of squares into between-group (SSC) and within-group (SSE) components. The tutorial is designed for beginners, emphasizing a slow and deliberate approach to grasp the fundamentals of one-way ANOVA.
Takeaways
- 📚 The video is part of a series on basic statistics, focusing on the concept of Analysis of Variance (ANOVA).
- 👍 The presenter encourages viewers to stay positive and reassures them that with hard work, practice, and patience, they can overcome challenges in their studies.
- 🔗 The presenter invites viewers to follow on various social media platforms to stay updated with new content and to foster a sense of community.
- 👍 The video encourages viewer interaction by asking for likes, shares, and constructive comments to improve future content.
- 🎓 The content is tailored for individuals who are new to statistics, ensuring that concepts are explained in a slow and deliberate manner.
- 📈 The video is divided into two parts: the first part discusses the conceptual background of ANOVA with examples and graphics, while the second part involves using Microsoft Excel for calculations.
- 🔍 The video explores the one-way ANOVA, also known as single-factor ANOVA or completely randomized design, which is used to compare means across multiple groups or populations.
- 📊 The presenter uses a hypothetical study involving students from different year levels at a university to illustrate the application of one-way ANOVA.
- 🧩 The video explains the importance of variance and sum of squares in ANOVA, detailing how total sum of squares (SST) is partitioned into sum of squares between columns (SSC) and sum of squares error (SSE).
- 📉 The concept of mean comparison is highlighted, with the video showing how to calculate column means, overall mean, and how these relate to the analysis.
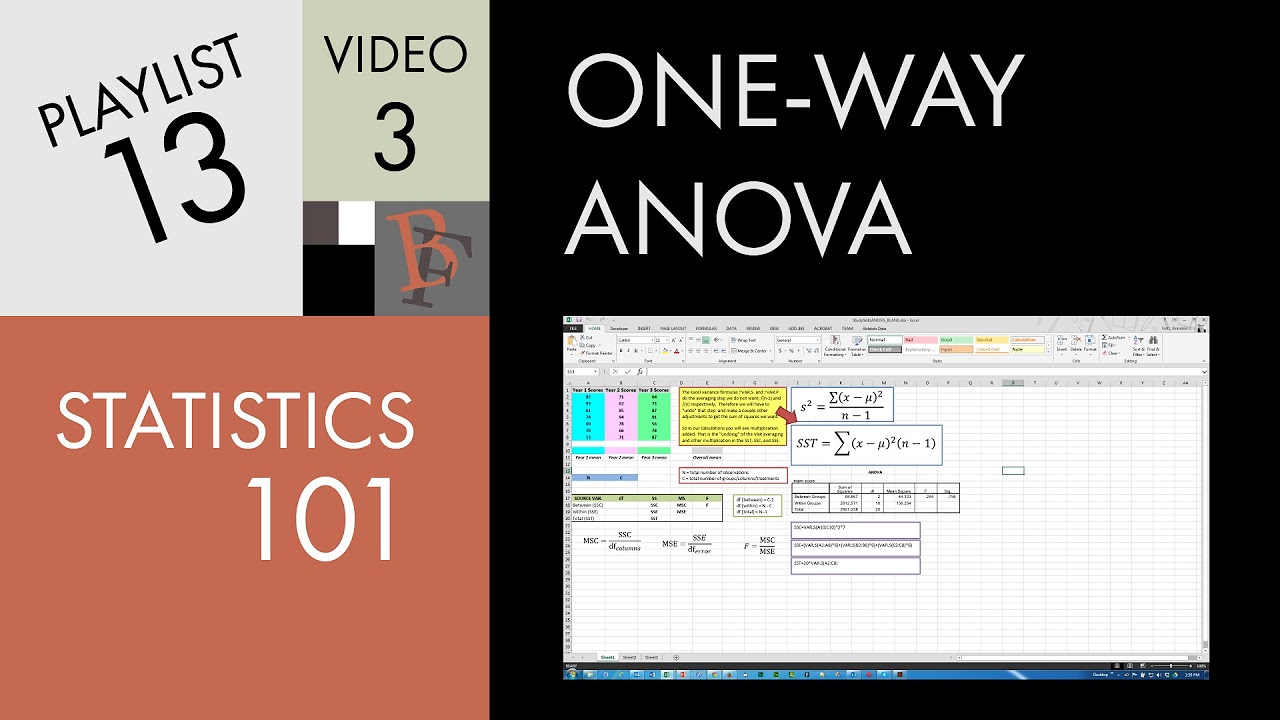
- 📝 The video concludes with a practical demonstration of performing a one-way ANOVA calculation in Excel, providing a step-by-step guide for the hand calculation.
Q & A
What is the main purpose of the video series on basic statistics?
-The main purpose of the video series is to provide an in-depth understanding of basic statistics concepts, with a focus on the analysis of variance (ANOVA), and to support individuals who are relatively new to statistics or are struggling with their class.
What is the advice given to individuals who are watching the video because they are struggling in a class?
-The advice given is to stay positive, keep their head up, and recognize that they have already accomplished a lot. The speaker encourages them to believe in their abilities, as hard work, practice, and patience can help them overcome their current challenges.
How can viewers stay updated with the video series and connect with the presenter?
-Viewers can follow the presenter on various social media platforms such as YouTube, Twitter, Google Plus, and LinkedIn to stay updated with new video uploads and to connect with the presenter online.
What is the significance of the acronym 'ANOVA' in the context of this video?
-ANOVA stands for 'Analysis of Variance,' and it is a statistical method that allows for the comparison of means across more than two populations or groups, which was not possible with previous methods like the independent samples t-test.
What is the difference between one-way ANOVA and two-way ANOVA mentioned in the video?
-One-way ANOVA, also known as single-factor ANOVA, is used to compare the means of three or more levels of a single factor. Two-way ANOVA, which will be discussed in a later video, is used to analyze the effect of two different factors on the response variable.
What is the example problem used in the video to illustrate the one-way ANOVA?
-The example problem involves an informal study conducted at the Autonomous University of Madrid, where the study skills of 21 students from three different year levels (first-year, second-year, and third-year) are assessed to determine if there is a significant difference in their study skills.
Why is it called a 'single-factor' ANOVA in the context of the example problem?
-It is called a 'single-factor' ANOVA because the study is focused on one factor, which is the year of study (first-year, second-year, third-year), with several levels within that factor.
What are the three types of means discussed in the video?
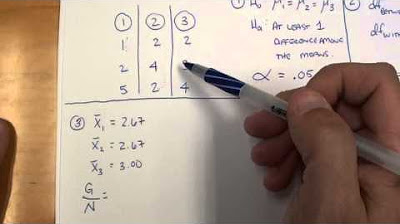
-The three types of means discussed are the mean for each column or group (X bar sub one, X bar sub two, X bar sub three), and the overall mean or grand mean, which is the mean of all 21 scores taken together.
What is the concept of variance and how is it related to ANOVA?
-Variance is the average squared deviation of a data point from the distribution mean. It is related to ANOVA because ANOVA is the analysis of variance, and it uses the concept of sum of squares, which is the variance without finding the average of the sum of squared deviations.
What are the two components that make up the total sum of squares (SST) in ANOVA?
-The two components that make up the total sum of squares (SST) are the sum of squares of the columns (SSC), which represents the between variance or treatment sum of squares, and the sum of squares error (SSE), which represents the within variance or error sum of squares.
Why is it incorrect to compare multiple groups using multiple t-tests instead of ANOVA?
-It is incorrect because doing multiple t-tests increases the chance of a type-one error, or the probability of incorrectly rejecting the null hypothesis. ANOVA is a more appropriate method as it controls for this by conducting a single test to compare all groups at once.
Outlines
😀 Introduction and Encouragement
Brandon welcomes viewers to his series on basic statistics, offering encouragement to those struggling and emphasizing the importance of hard work, practice, and patience. He encourages viewers to connect with him on social media and to provide feedback on the videos. He outlines the scope of the series, particularly focusing on ANOVA (Analysis of Variance), and divides the video into two parts: conceptual background and practical application using Microsoft Excel.
📊 Understanding ANOVA
Brandon introduces the concept of ANOVA, explaining its importance in comparing more than two populations. He describes different types of ANOVA, focusing on one-way ANOVA for this video, and highlights its significance in statistical analysis. He uses a fictitious study involving students from different academic years to illustrate the application of one-way ANOVA.
📈 Calculating Means and Overall Mean
Brandon explains the process of calculating means for each group and the overall mean. He discusses the interpretation of these means, pointing out that the year-one student scores seem different from the other two groups. He introduces the concept of variance and sum of squares, essential components of ANOVA, explaining their calculation and significance in statistical analysis.
🔢 Sum of Squares: Total, Columns, and Error
Brandon delves deeper into the sum of squares, explaining its types: total (SST), columns (SSC), and error (SSE). He demonstrates how to calculate each type using the fictitious data. He emphasizes the importance of these calculations in understanding variance within and between groups, forming the basis for conducting ANOVA.
📝 Visualizing and Summarizing Sum of Squares
Brandon summarizes the different types of sum of squares and their relationships. He provides a visual representation of the data, highlighting the distinctions between group means and their deviations from the overall mean. He concludes part one of the video by reiterating the importance of understanding variance and sum of squares in ANOVA. He prepares viewers for part two, which involves practical computation of ANOVA in Excel.
Mindmap
Keywords
💡ANOVA
💡Variance
💡Sum of Squares
💡One-Way ANOVA
💡Independent Samples T-Test
💡Excel
💡Constructive Comment
💡Completely Randomized Design
💡Grand Mean
💡Type-One Error
Highlights
Introduction to the series on basic statistics with an emphasis on positivity and perseverance for struggling students.
Encouragement for viewers to follow the creator on various social media platforms for updates and community engagement.
Invitation for viewers to provide feedback through likes and constructive comments to improve future video content.
Explanation of the intended audience for the video: individuals who are relatively new to statistics.
Introduction to the topic of Analysis of Variance (ANOVA) and its significance in comparing multiple populations.
Division of the video into two parts: conceptual background and practical application using Microsoft Excel.
Overview of the limitations of previous methods and how ANOVA overcomes them by allowing comparison of multiple groups.
Differentiation between one-way ANOVA and two-way ANOVA, with a focus on the former in this video.
Description of one-way ANOVA as a single-factor analysis, also known as completely randomized design.
Comprehensive explanation of the conceptual framework underlying ANOVA through illustrations and example problems.
Presentation of a fictitious study on student study skills at the Autonomous University of Madrid as an example problem.
Discussion on the importance of variance and sum of squares in understanding the ANOVA technique.
Explanation of the total sum of squares (SST) as the foundation of ANOVA, partitioned into two components: SSC and SSE.
Illustration of how to calculate the sum of squares for columns (SSC) and its role in ANOVA.
Clarification of the sum of squares error (SSE) as the within-group variance and its calculation method.
Demonstration of the relationship between SSC, SSE, and SST, and their collective contribution to the ANOVA analysis.
Conclusion of part one with a summary of the one-way ANOVA process and its significance in statistical analysis.
Transition to part two, which will cover the practical calculation of one-way ANOVA using Microsoft Excel.
Transcripts
Browse More Related Video

5.0 / 5 (0 votes)
Thanks for rating: