Elementary Statistics - Chapter 11 Chi Square Goodness of Fit Test
TLDRThis script offers an in-depth tutorial on the Chi-Square Goodness-of-Fit Test, explaining its purpose for assessing the fit between observed and expected frequencies. It covers hypothesis statements, the characteristics of the Chi-Square distribution, and the process of calculating the test statistic using observed and expected frequencies. The tutorial also illustrates how to determine expected frequencies, use Chi-Square distribution tables to find critical values, and make decisions based on the test statistic in relation to the critical value. Practical examples, including employee absences and tax preparation methods, demonstrate the application of the test in real-world scenarios.
Takeaways
- 🔍 The chi-square goodness-of-fit test is used to determine if observed data fits a theoretical distribution, comparing observed frequencies to expected ones.
- 🎲 The observed frequency is the result from an experiment, like flipping a coin 10 times, whereas the expected frequency is the theoretical probability, such as a 50/50 chance for heads or tails.
- ❌ The null hypothesis states there is no difference between observed and expected frequencies, while the alternative hypothesis suggests there is a difference.
- 📊 The chi-square distribution is positively skewed, non-negative, and based on degrees of freedom, with each degree of freedom creating a new distribution.
- 📚 The test uses notations like L for observed frequency, E for expected frequency, K for categories, N for total trials, and P for probability within a category.
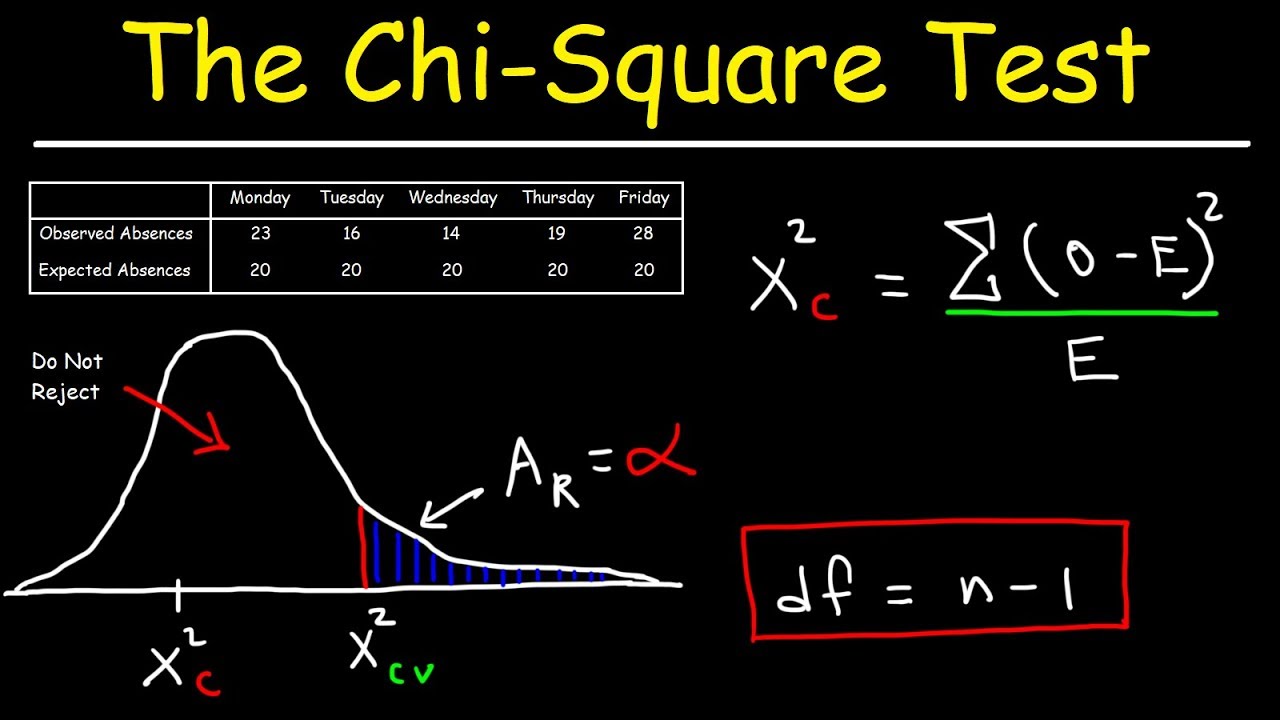
- 🧮 The chi-square test statistic formula combines observed and expected data to calculate a value that helps determine if the null hypothesis can be rejected.
- 📉 The test is a right-tail test, meaning it's always looking for the test statistic to be greater than the critical value or a certain p-value.
- 📈 Finding the expected frequency can be done by dividing the total number of trials by the number of categories if equally likely, or by multiplying the total frequency by the expected probability for each category.
- 📝 The chi-square test for independence uses contingency tables to examine the relationship between two categorical variables, with the null hypothesis suggesting independence and the alternative suggesting dependence.
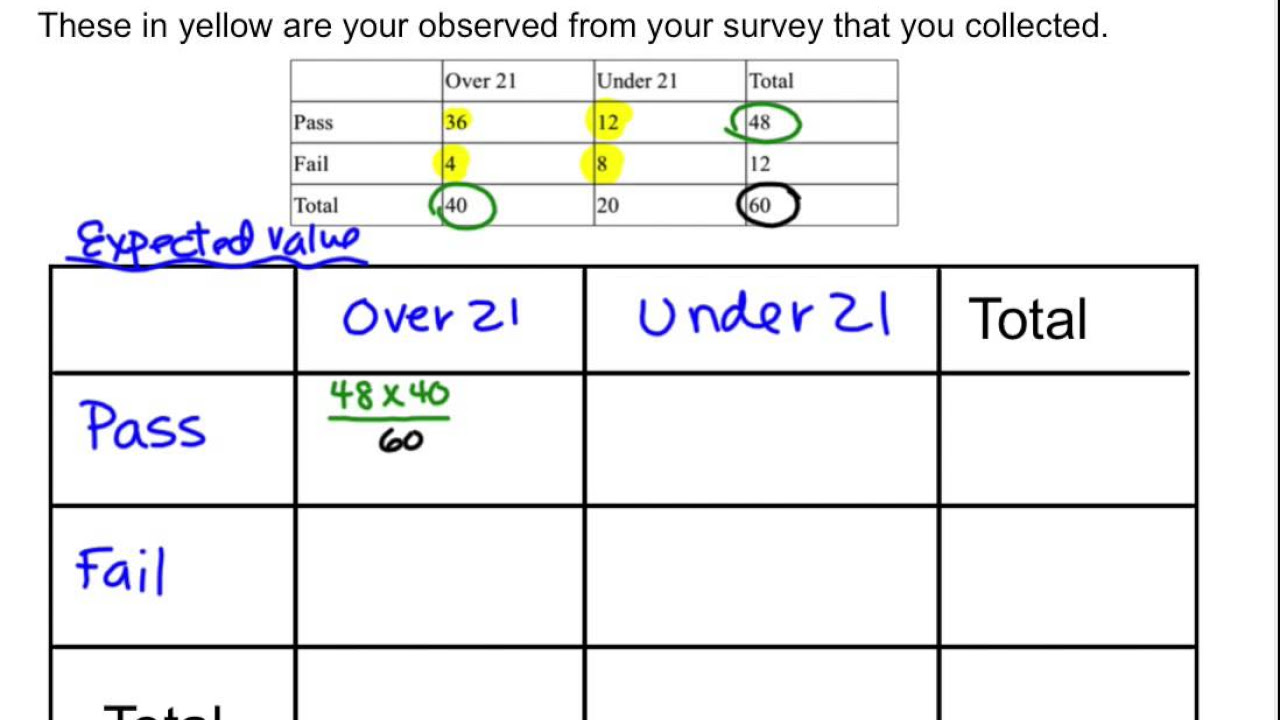
- 📋 The expected frequency for a contingency table is calculated by multiplying the row and column totals and dividing by the grand total for each cell.
- 📊 For the chi-square test, the observed frequencies must be from a random sample, and each expected frequency must be greater than or equal to 5 to ensure validity.
Q & A
What is the primary purpose of the chi-square goodness-of-fit test?
-The chi-square goodness-of-fit test is used to test whether an observed frequency distribution fits a specific claimed distribution. It compares observed values to expected or theoretical values to determine if there is an association between two variables.
How do you state the null and alternative hypotheses for a chi-square goodness-of-fit test?
-The null hypothesis states that there is no difference between the observed and expected frequencies. The alternative hypothesis states that there is a difference between the observed and expected frequencies.
What are the characteristics of a chi-square distribution?
-A chi-square distribution is positively skewed, non-negative, and based on degrees of freedom. Each degree of freedom creates a new distribution.
What notations are used in the chi-square goodness-of-fit test?
-The notations include: L for observed frequency, E for expected frequency, K for the number of different categories, N for the number of trials or total observed sample values, and P for the probability that a sample value falls within a particular category.
How is the test statistic calculated in the chi-square goodness-of-fit test?
-The test statistic is calculated using the formula that incorporates the observed data and expected data. The specific formula is sum((O - E)^2 / E), where O is the observed frequency and E is the expected frequency.
How do you interpret the p-value in the chi-square goodness-of-fit test?
-The p-value is compared to the significance level (alpha). If the p-value is less than or equal to alpha, you reject the null hypothesis. If it is greater, you fail to reject the null hypothesis.
What is the process for finding the critical value in the chi-square test?
-The critical value is found in the chi-square distribution table using the degree of freedom (categories minus 1) and the significance level (alpha). The test statistic is compared to this critical value to determine whether to reject the null hypothesis.
What are the requirements for using the chi-square goodness-of-fit test?
-The observed frequency must be obtained by a random sample, and each expected frequency must be greater than or equal to 5.
How do you find the expected frequency when given percentages for each category?
-To find the expected frequency, multiply the total number of observations by the percentage (as a decimal) for each category.
What steps are involved in conducting a chi-square goodness-of-fit test?
-The steps are: (1) find the expected frequency and verify each is at least 5, (2) state the null and alternative hypotheses, (3) find the critical value using the chi-square table, (4) calculate the test statistic, (5) compare the test statistic to the critical value, and (6) determine whether to reject or fail to reject the null hypothesis.
Outlines
📊 Chi-Square Goodness-of-Fit Test Basics
The Chi-Square Goodness-of-Fit Test is introduced as a statistical method to evaluate the fit between observed data and expected theoretical distributions. The test is exemplified by a coin flip scenario, illustrating the difference between observed and expected outcomes. The null hypothesis posits no difference between observed and expected frequencies, while the alternative hypothesis suggests a discrepancy. The test's characteristics, including its positively skewed distribution and reliance on degrees of freedom, are explained. The formula for calculating the test statistic is provided, and the process of comparing this statistic to a critical value or p-value at a given significance level (alpha) is detailed. The test is always a right-tail test, and the decision to reject or fail to reject the null hypothesis is based on whether the test statistic exceeds the critical value.
🔢 Calculating Expected Frequencies
This section delves into the process of determining expected frequencies, which is essential for conducting the Chi-Square Goodness-of-Fit Test. It explains how to calculate expected frequencies when outcomes are equally likely by dividing the total number of trials by the number of categories. It also addresses how to find expected frequencies when given percentages for each category, by multiplying the total frequency by the expected probability for each category. Two examples are provided: one involving employee absences by day of the week and another regarding tax preparation methods among adults. The examples demonstrate how to sum frequencies, calculate total and expected frequencies, and interpret the results in the context of the Chi-Square Test.
📚 Chi-Square Test for Observed and Expected Frequencies
The paragraph outlines the prerequisites for using the Chi-Square Goodness-of-Fit Test, emphasizing that observed frequencies must be derived from a random sample and that each expected frequency should be at least 5. It details the steps for performing the test, including finding the expected frequency, verifying the conditions for expected frequencies, stating the null and alternative hypotheses, and identifying the significance level (alpha) and degree of freedom. The process of finding the critical value from a Chi-Square distribution table is explained, and the method for calculating the test statistic using a calculator or online tool is described. The decision to reject or fail to reject the null hypothesis is based on whether the test statistic is greater than the critical value, indicating a difference between observed and expected frequencies.
📉 Contingency Tables and Chi-Square Test for Independence
This section introduces contingency tables, which are used to display observed frequencies for two categorical variables in rows and columns. The Chi-Square Test for Independence is explained as a method to determine whether there is a relationship between the two variables. The null hypothesis suggests that the variables are independent, while the alternative hypothesis posits a dependence. The process of finding expected frequencies in each cell of the table is detailed, using the formula that multiplies row and column totals and divides by the grand total. An example involving smoking habits of students related to their parents' smoking is provided, demonstrating how to calculate expected frequencies and apply the Chi-Square Test for Independence.
🏋️♂️ Chi-Square Independence Test with Health Club Data
The paragraph presents a practical application of the Chi-Square Independence Test using data from a health club manager who wants to determine if the number of days college students exercise per week is related to gender. The null hypothesis states that the number of exercise days is independent of gender, while the alternative hypothesis suggests a dependence. The process includes stating the hypotheses, finding the critical value using the Chi-Square distribution table, and calculating the test statistic with the help of a calculator's matrix function. The test statistic is then compared to the critical value to decide whether to reject or fail to reject the null hypothesis, concluding whether there is evidence of a relationship between exercise frequency and gender.
🧐 Interpreting Chi-Square Test Results for Hypothesis Testing
This final paragraph summarizes the process of interpreting Chi-Square Test results in the context of hypothesis testing. It emphasizes that the test is always a right-tail test, and the decision to reject or fail to reject the null hypothesis is based on the comparison of the test statistic to the critical value. The paragraph also provides examples of how to state conclusions based on the test outcomes, such as concluding that CEOs' ages are dependent on company size when the null hypothesis is rejected. The importance of the right-tail test and the significance of the test statistic in relation to the critical value are highlighted.
Mindmap
Keywords
💡Chi-square goodness-of-fit test
💡Observed frequency
💡Expected frequency
💡Null hypothesis
💡Alternative hypothesis
💡Chi-square distribution
💡Degrees of freedom
💡Critical value
💡Contingency table
💡Test statistic
💡P-value
Highlights
The chi-square goodness-of-fit test is used to determine if observed frequencies match expected frequencies under a theoretical distribution.
The observed frequency comes from experimental data, while the expected frequency is based on theoretical probabilities.
Null hypothesis states no difference between observed and expected frequencies; alternative hypothesis suggests a difference.
Chi-square distribution is positively skewed, non-negative, and based on degrees of freedom.
Notation for chi-square test includes observed frequency (L), expected frequency (E), number of categories (K), and total sample size (N).
The chi-square test formula combines observed and expected data to calculate the test statistic.
A p-value is compared to a significance level (alpha) to determine if the null hypothesis should be rejected.
Critical values from chi-square distribution tables are used for hypothesis testing, based on degrees of freedom and alpha level.
Goodness-of-fit tests are always right-tailed because the chi-square distribution is positively skewed.
Expected frequency is calculated by dividing the total number of trials by the number of categories when outcomes are equally likely.
If outcomes are not equally likely, expected frequency is found by multiplying the total frequency by the expected probability for each category.
An example demonstrates calculating expected frequencies for employee absences by day of the week.
Another example shows how to find expected frequencies when given percentages for different categories, such as tax preparation methods.
Chi-square test for independence examines the relationship between two categorical variables using contingency tables.
The expected frequency in a contingency table is calculated by multiplying row and column totals and dividing by the grand total.
The degree of freedom for a chi-square test of independence is determined by (rows - 1) * (columns - 1).
Examples illustrate the process of finding expected frequencies and performing chi-square tests for both goodness-of-fit and independence.
The chi-square test requires that observed frequencies are from a random sample and expected frequencies are at least 5.
The process of using a calculator for chi-square tests is explained, including entering data into lists and using matrix functions for expected values.
Transcripts
Browse More Related Video


5.0 / 5 (0 votes)
Thanks for rating: