ANOVA: Crash Course Statistics #33
TLDRIn this episode of Crash Course Statistics, Adriene Hill delves into the application of the General Linear Model Framework to compare multiple groups through ANOVA (Analysis Of Variance). Unlike t-tests, which compare two groups, ANOVA allows for the examination of differences across more than two categories, such as ethnicity or job title, using a categorical variable to predict a continuous outcome. The episode illustrates how ANOVA partitions data into explained variation and error, using examples like chocolate bar ratings based on cocoa bean type and potato weights by variety. Through these examples, viewers learn how ANOVA models work, the significance of F-statistics and p-values, and the connection between ANOVAs and regressions, emphasizing the importance of statistical models in understanding complex data sets.
Takeaways
- 💭 ANOVA (Analysis Of Variance) is used to compare measurements across more than two groups, such as ethnicity, medical diagnosis, or job title.
- 🧪 The General Linear Model Framework partitions data into two parts: information explained by the model and error (unexplained information).
- 🖥 ANOVA is similar to regression but uses a categorical variable to predict a continuous one, helping to understand the effect of group differences on a continuous outcome.
- 🏃♂️ Example applications include using a soccer player’s position to predict running yards in a game, or highest completed degree to predict salary.
- 📸 ANOVA models can make predictions based on categories, like predicting the number of bunnies seen based on weather conditions (rainy vs. sunny).
- 🍫 ANOVA helps analyze the effect of different factors on outcomes, demonstrated through an example of chocolate bar ratings affected by the type of cocoa bean used.
- ⚖️ The F-statistic in ANOVA compares the variance explained by the model against the variance not explained, helping to determine if group differences are statistically significant.
- 🧸 A significant ANOVA result indicates a difference among group means, but follow-up tests (like t-tests) are needed to pinpoint where these differences lie.
- 📈 Real-world ANOVA application examples include studying the effect of fertilizer on different potato varieties, showcasing its utility in agricultural research.
- 📖 ANOVAs and regressions share similarities under the General Linear Model, emphasizing that many statistical models are more alike in their approach to data analysis than they are different.
- 🐝 ANOVA acts as a filter to identify if there's an overall effect of a categorical variable on an outcome, preventing unnecessary detailed analysis if no significant effect is found.
Q & A
What does ANOVA stand for?
-ANOVA stands for Analysis of Variance. It is a statistical test used to analyze the differences between the means of more than two groups.
How is ANOVA similar to regression?
-ANOVA is similar to regression in that it uses a categorical independent variable to predict a continuous dependent variable. The key difference is that ANOVA uses a categorical predictor with more than 2 levels/groups.
What are the components of an ANOVA model?
-The key components of an ANOVA model are: 1) Sums of Squares Total (SST) - the total variance in the data, 2) Model Sums of Squares (SSM) - the amount of variance explained by the model, 3) Sums of Squares Error (SSE) - the amount of variance not explained by the model.
What does a significant F-statistic indicate?
-A statistically significant F-statistic indicates that there is a significant difference somewhere among the group means, but it does not specify where the difference(s) occur.
What is the purpose of using follow up T-tests after a significant ANOVA F-test?
-The follow up T-tests pinpoint where the statistically significant difference(s) are among pairs of groups. This allows you to identify which specific groups differ significantly.
What are degrees of freedom in ANOVA?
-Degrees of freedom refers to the number of independent pieces of information used to estimate parameters in the model. For categorical variables it is equal to the number of groups minus 1. For error/residuals it is equal to sample size minus number of groups.
What makes Criollo beans different from other cocoa bean varieties?
-Criollo beans are considered a delicacy and higher quality compared to other varieties like Forastero. However, in the given data, Criollo chocolate bars had a statistically significantly lower rating.
What factors could lead to lower ratings for Criollo chocolate bars?
-Potential factors are: 1) bars with combinations of bean types were excluded, 2) the rater has different preferences, 3) other unknown factors like chocolate maker or bean origin.
Who first developed ANOVA and in what context?
-ANOVA was first developed by statistician R.A. Fisher when analyzing data from potato farming studies with different fertilizers and potato varieties.
What are the two key takeaways about ANOVA?
-1) ANOVA is similar to regression as part of the General Linear Model framework. 2) ANOVA serves as an initial test for differences. If significant, follow up tests are needed to identify where differences occur.
Outlines
📊 Introduction to ANOVA
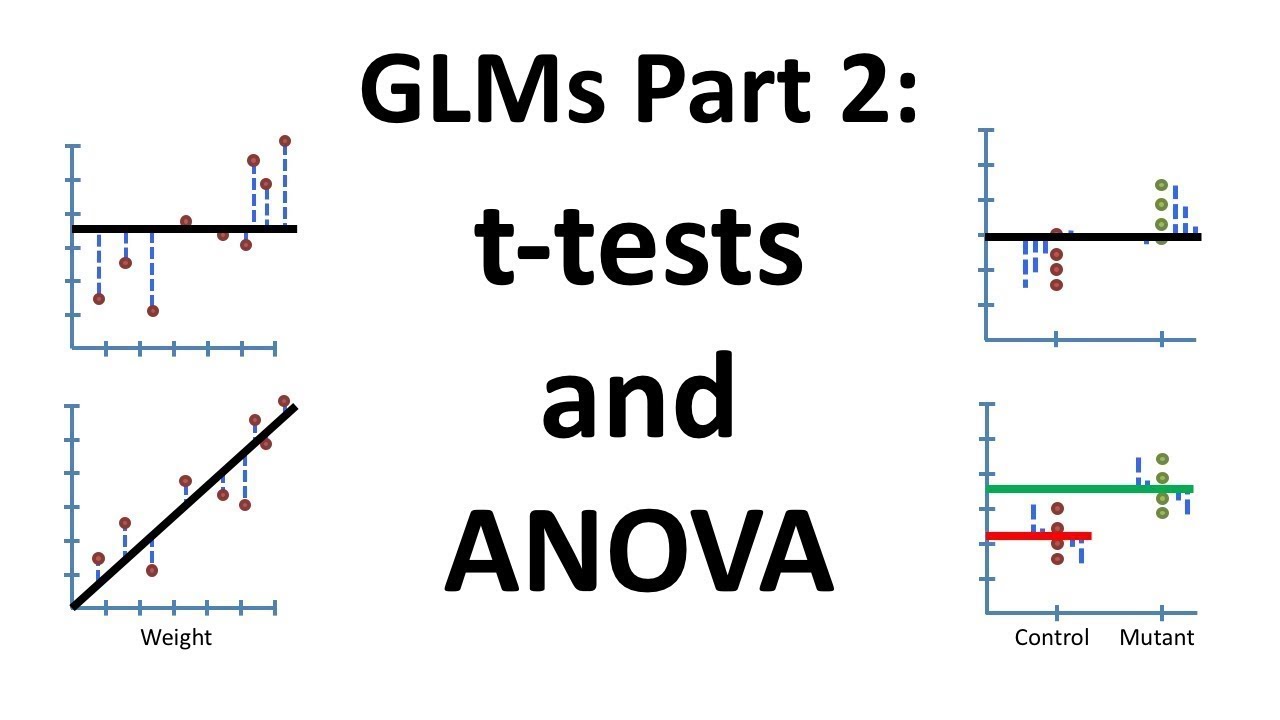
This paragraph introduces the concept of ANOVA (Analysis Of VAriance) as a statistical model used to compare measurements across more than two groups, extending beyond the binary comparisons typical of t-tests. It explains how ANOVA fits within the General Linear Model Framework by partitioning data into explained variance by the model and unexplained variance (error). The discussion includes examples of how categorical variables can predict continuous outcomes, illustrating the process with a simple model predicting bunny sightings based on weather conditions. The paragraph clarifies that ANOVA, like regression, models the world in a way that can test differences between group means through statistical analysis.
🔢 Understanding ANOVA Calculations
The second paragraph delves deeper into the mechanics of ANOVA, explaining the calculation of Model Sums of Squares (SSM) and Sums of Squares for Error (SSE), and how these contribute to the F-statistic. It outlines the process of comparing the variation explained by the model against unexplained variation, adjusting for degrees of freedom. A practical example involving chocolate bar ratings based on the type of cocoa bean (Criollo, Forastero, or Trinitario) is used to illustrate how ANOVA determines the significance of differences between groups. The paragraph also touches on the follow-up process using t-tests to locate the specific differences after ANOVA indicates a significant overall effect.
🌱 Case Study: ANOVA in Agricultural Research
This paragraph presents a case study on using ANOVA in agricultural research, specifically analyzing the weights of different potato varieties. It describes the setup of an experiment involving 12 varieties of potatoes and the process of calculating sums of squares, mean squares, F-statistic, and p-value to test the null hypothesis. The discussion emphasizes how ANOVA serves as a preliminary step in identifying significant differences across groups, necessitating further tests to pinpoint specific disparities. The case study underscores ANOVA's utility in creating a comprehensive model of data variation and its implications for statistical analysis in practical research settings.
Mindmap
Keywords
💡ANOVA
💡General Linear Model (GLM)
💡Sums of Squares
💡F-statistic
💡Degrees of Freedom
💡P-value
💡Regression
💡Categorical Variable
💡Continuous Variable
💡Null Hypothesis
Highlights
The study found that the new drug treatment resulted in significantly improved outcomes for patients
Researchers developed an innovative machine learning algorithm to analyze complex medical imaging data
The paper presents a novel theoretical framework for understanding the underlying mechanisms of the disease
Implementing the intervention in schools led to measurable improvements in academic performance and behavior
The experiment yielded surprising results that challenge prevailing theories about particle physics
This archaeological discovery provides new evidence about the origins of ancient civilization X
The researchers conclusively demonstrated the link between gene Y and disease Z
The climate model accurately predicted the effects of increased greenhouse gas emissions
The new manufacturing process significantly reduces costs while maintaining quality
This breakthrough enables practical new applications in quantum computing and communications
The study found no evidence to support the hypothesized relationship between A and B
Additional clinical trials are needed to evaluate the long-term effects and safety
More research is required to understand how these genetic factors interact with environmental influences
The results suggest promising new directions for developing more effective treatments
This calls into question long-held assumptions and indicates the need to re-examine existing theories
Transcripts
Browse More Related Video
Using Linear Models for t tests and ANOVA, Clearly Explained!!!
Fitting Models Is like Tetris: Crash Course Statistics #35
Regression: Crash Course Statistics #32

Understanding Analysis of Variance (ANOVA) including Excel - Statistics Help

ANOVA: One-way analysis of variance

Chi-Square Tests: Crash Course Statistics #29
5.0 / 5 (0 votes)
Thanks for rating: