ANOVA: One-way analysis of variance
TLDRIn this Zed Statistics video, host Justin Zelza introduces One Way ANOVA, a statistical method for analyzing variance between and within groups. He explains the concept of total sum of squares (SST) and guides viewers through calculating it for sample data. The video then delves into the ANOVA process, breaking down SST into within-group and between-group components. Zelza illustrates how to determine if differences in group means are statistically significant using the F-statistic and P-values. He concludes with a practical demonstration using an Excel spreadsheet, allowing viewers to manipulate data and observe ANOVA results.
Takeaways
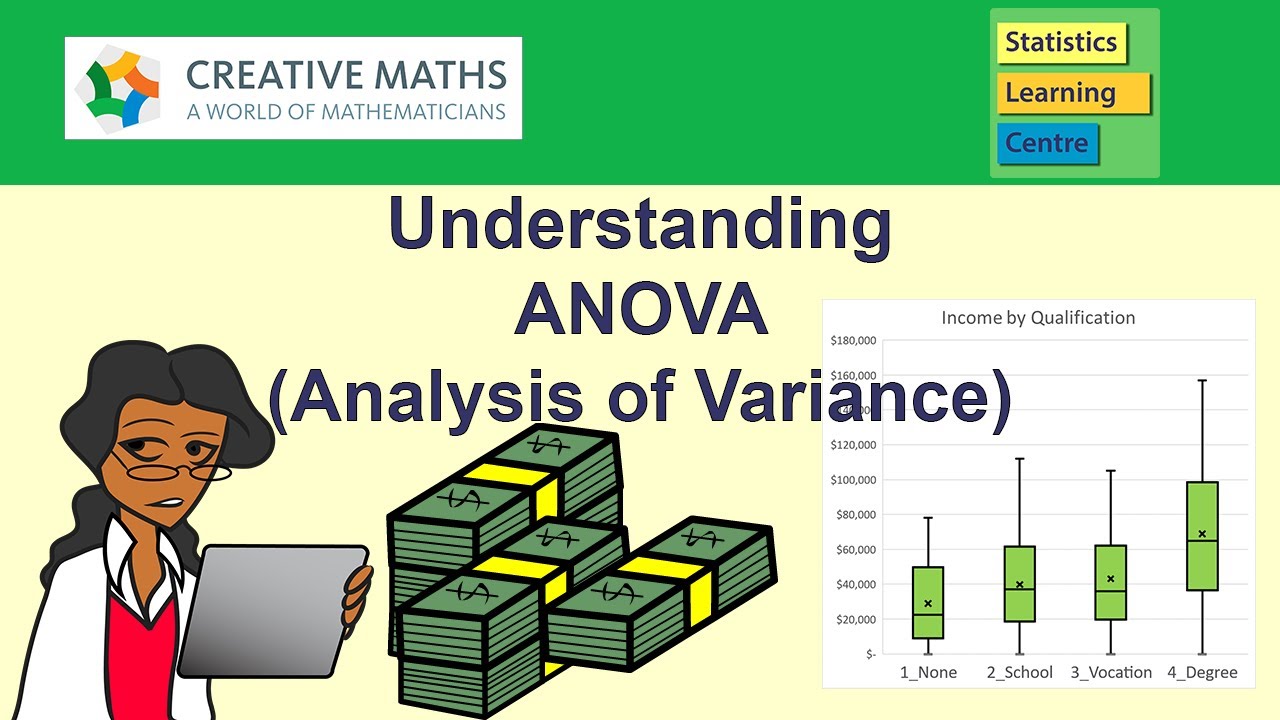
- 📚 Anova, or Analysis of Variance, is a statistical method used to determine if there are any statistically significant differences between the means of three or more independent (unrelated) groups.
- 🔍 One Way Anova is a specific type of Anova that deals with a single variable and is used to compare the means of three or more groups.
- 📈 The concept of variance is central to Anova, which is calculated as the sum of the squared deviations from the mean, also known as the Total Sum of Squares (SST).
- 📝 To calculate the SST, subtract the mean from each observation, square the result, and sum these values for all observations.
- 🧩 In the context of One Way Anova, the total variation in data (SST) is partitioned into two components: the Sum of Squares Within groups (SSW) and the Sum of Squares Between groups (SSB).
- 📊 The Sum of Squares Within groups (SSW) measures the variation of individual observations within each group from their respective group mean.
- 📉 The Sum of Squares Between groups (SSB) measures the variation between the group means and the overall mean of all observations.
- 🔢 The F-statistic is used in Anova to determine if the variation between group means is significantly greater than the variation within groups, calculated as the ratio of Mean Square Between groups to Mean Square Within groups.
- 📉 A higher F-statistic indicates a greater likelihood of rejecting the null hypothesis that all group means are equal.
- 📊 The degrees of freedom for the numerator in the F-statistic calculation is the number of groups minus one, and for the denominator, it is the total number of observations minus the number of groups.
- 🔑 P-values associated with the F-statistics help determine the statistical significance of the results, with lower P-values indicating stronger evidence against the null hypothesis.
Q & A
What is the main topic of the video?
-The main topic of the video is the concept of ANOVA (Analysis of Variance), specifically One Way ANOVA, and its application in statistics.
What is the formula for variance and what does it measure?
-The formula for variance is the sum of the squared deviations from the mean of each observation (Σ(x - mean)²) divided by N-1. It measures the spread or dispersion of the data.
What is the acronym SST and what does it represent?
-SST stands for Total Sum of Squares. It represents the total variance or spread of the data, calculated as the sum of squared differences between each observation and the overall mean.
How does the video suggest to find the total sum of squares for two samples?
-The video suggests using the variance formula to calculate the total sum of squares for each sample, by finding the mean of the sample, then squaring and summing the differences between each observation and the mean.
What is the purpose of One Way ANOVA?
-The purpose of One Way ANOVA is to determine if there are any statistically significant differences between the means of three or more groups or categories.
How does One Way ANOVA split the total sum of squares?
-One Way ANOVA splits the total sum of squares into two components: the sum of squares within groups (SSW) and the sum of squares between groups (SSB).
What is the F statistic used for in the context of One Way ANOVA?
-The F statistic is used to determine whether the sum of squares between groups is large enough to indicate a statistically significant difference between the group means.
How is the mean square calculated in ANOVA?
-The mean square is calculated by dividing the sum of squares (either within groups or between groups) by their respective degrees of freedom.
What are the degrees of freedom for the numerator and denominator in the F statistic calculation?
-The degrees of freedom for the numerator is the number of groups minus one (C-1), and for the denominator, it is the total number of observations minus the number of groups (N-C).
What does the video suggest for further practice with One Way ANOVA?
-The video suggests downloading and using the provided Excel spreadsheet to input different values and observe the effects on the ANOVA calculations, F statistic, and P values.
What is the null hypothesis tested by One Way ANOVA?
-The null hypothesis tested by One Way ANOVA is that all group means are equal, and the test aims to determine if there is enough evidence to reject this hypothesis in favor of the alternative hypothesis that at least one group mean is different.
How can you interpret the F statistic and P value in the context of One Way ANOVA?
-A higher F statistic indicates a greater likelihood of rejecting the null hypothesis. The P value associated with the F statistic determines the statistical significance; a lower P value (typically below a chosen significance level like 0.05) suggests that the difference between group means is statistically significant.
Outlines
📚 Introduction to One Way ANOVA
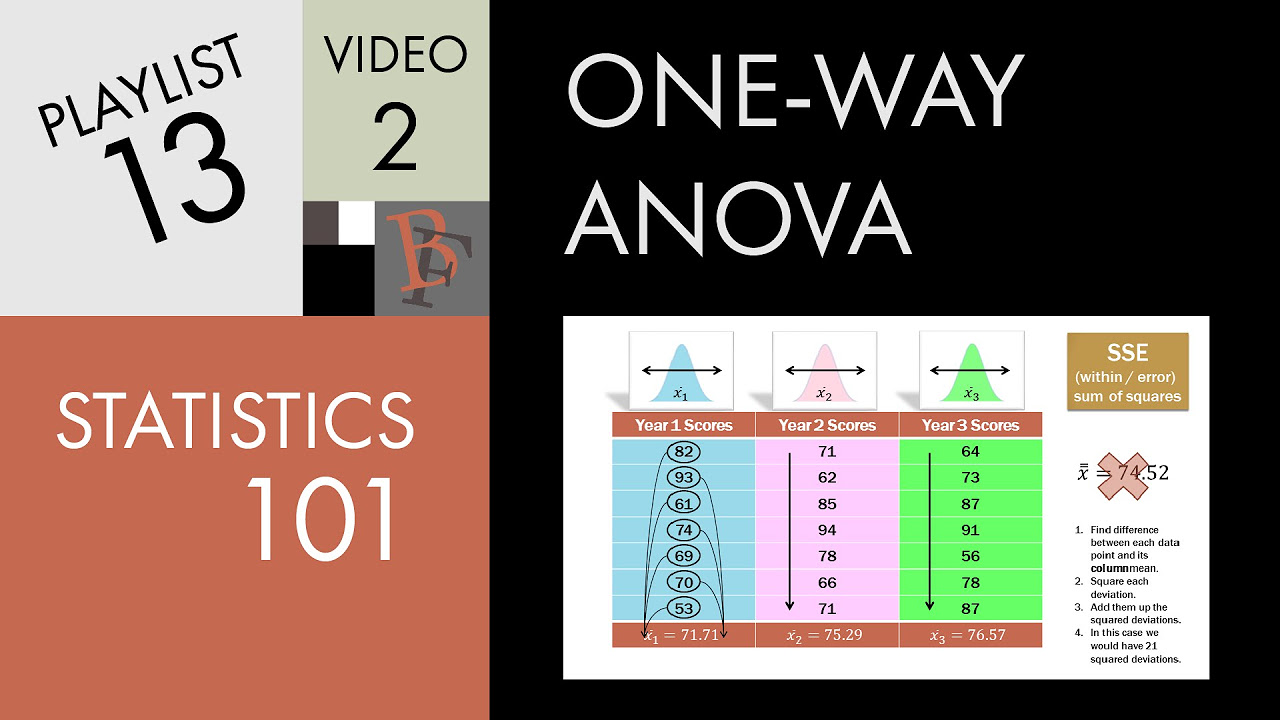
The video script introduces the concept of ANOVA, or Analysis of Variance, a fundamental statistical method used to compare the means of more than two groups. The presenter discusses the relevance of ANOVA in the context of regression and introduces the specific focus of the video, which is One Way ANOVA. The script explains the basic formula for calculating variance, emphasizing the Total Sum of Squares (SST) as a measure of data spread. The audience is challenged to calculate the SST for two given data samples, A and B, to understand the concept of variance. The script also provides an example of One Way ANOVA with nine students' scores, illustrating how to calculate the SST and how it can be used to determine if there are significant differences between groups.
🔍 Calculating Sum of Squares and One Way ANOVA
This paragraph delves deeper into the mechanics of One Way ANOVA, explaining how the total sum of squares is divided into two components: the sum of squares within groups and the sum of squares between groups. The script provides a step-by-step example of calculating these components for a set of data, illustrating how to find the mean of each group and calculate the sum of squares for both within and between groups. The presenter clarifies that the total sum of squares is the sum of these two components, a key property of ANOVA. The script also discusses the use of the F-statistic to determine if the variation between groups is statistically significant, introducing the concept of degrees of freedom and how they are calculated.
📉 Interpreting ANOVA Results and Excel Application
The final paragraph of the script discusses how to interpret the results of One Way ANOVA, using F-statistics and P-values to assess whether the means of different groups are significantly different. The script contrasts two examples, one with no significant difference between group means and another where there is a significant difference, as indicated by a higher F-statistic and a lower P-value. The presenter also mentions an Excel spreadsheet that viewers can use to input their own data and observe how ANOVA values, F-statistics, and P-values change accordingly. The script concludes with a brief overview of the ANOVA output in Excel, including sum of squares, degrees of freedom, and mean squares, and encourages viewers to familiarize themselves with this format.
Mindmap
Keywords
💡ANOVA
💡Variance
💡Sum of Squares
💡One Way ANOVA
💡Mean
💡Degrees of Freedom
💡F-statistic
💡Null Hypothesis
💡P-value
💡Excel Spreadsheet
Highlights
Introduction to the concept of ANOVA (Analysis of Variance) and its importance in statistics.
Explanation of ANOVA in the context of One Way Anova, differentiating it from its application in regression.
The variance formula and its significance in understanding the spread of data.
The concept of Total Sum of Squares (SST) and its role in analyzing the spread of data.
Exercise for finding the Total Sum of Squares for given data samples.
Calculation of means for data samples and its importance in SST computation.
Illustration of how SST indicates the spread or variance within a dataset.
Introduction of a theoretical example involving nine students' scores to explain One Way Anova.
The process of dividing Total Sum of Squares into Within Groups and Between Groups.
Explanation of how to calculate the Sum of Squares Within Groups for individual streams.
Demonstration of calculating the Sum of Squares Between Groups with respect to the global mean.
The property that Total Sum of Squares equals the sum of Within and Between Groups Sum of Squares.
The use of an F-statistic to assess whether the variation between groups is statistically significant.
Hypothesis testing in One Way Anova and the role of P values in determining significance.
Practical application of One Way Anova through an Excel spreadsheet for analyzing exam scores.
How to manipulate data in the Excel spreadsheet to observe changes in Anova values, F-statistic, and P value.
Familiarization with the Anova output format commonly used in statistical analysis.
Conclusion of the tutorial with a summary of One Way Anova and its practical implications.
Transcripts
Browse More Related Video
Understanding Analysis of Variance (ANOVA) including Excel - Statistics Help

Excel - One-Way ANOVA Analysis Toolpack
Statistics 101: One-way ANOVA, A Visual Tutorial

One way ANOVA using Excel(one way anova)(ANOVA)(anova)(excel)(EXCEL)

How to Calculate ANOVA with Excel (Analysis of Variance)

ANOVA (Analysis of variance) simply explained
5.0 / 5 (0 votes)
Thanks for rating: