Using Linear Models for t tests and ANOVA, Clearly Explained!!!
TLDRThis StatQuest episode delves into the application of linear regression techniques to perform t-tests and ANOVA, using a design matrix to simplify the process. The tutorial begins with a review of linear regression, explaining how to predict mouse size from weight using R-squared and p-values. It then transitions to t-tests, comparing gene expression between control and mutant mice, and demonstrates how to calculate p-values for these tests. The episode also covers ANOVA, testing for differences across multiple categories, and introduces the concept of design matrices, which are essential for general linear models. The video concludes with a comparison of different design matrices and a teaser for future episodes.
Takeaways
- 🎬 StatQuest is brought to you by the genetics department at the University of North Carolina at Chapel Hill.
- 🔍 This video is part two of a series on General Linear Models, focusing on using linear regression techniques for t-tests and ANOVA.
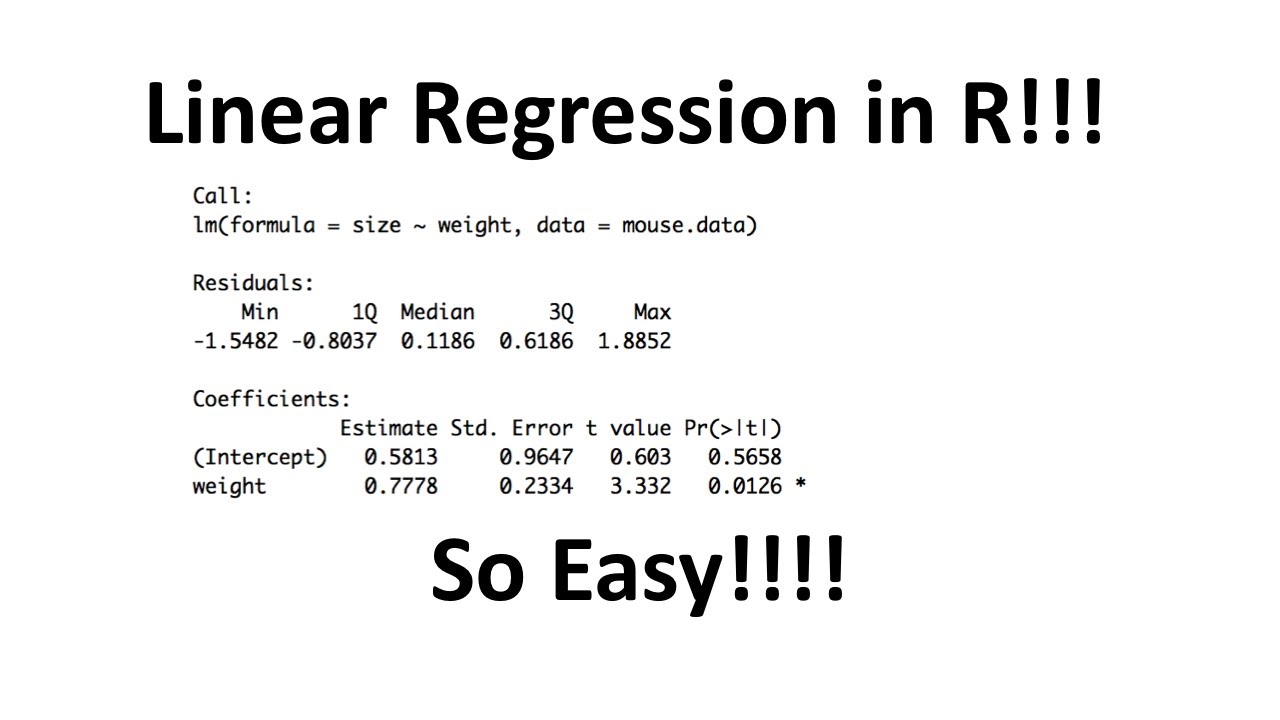
- 📊 Linear regression helps predict mouse size based on weight, using r-squared and p-values to measure usefulness and chance.
- 🧬 A t-test compares means to see if they are significantly different, using techniques from linear regression.
- 🧮 Step one for t-tests is to ignore the x-axis and find the overall mean, calculating the sum of squared residuals around this mean.
- 📈 Fitting a line to the data for t-tests involves finding the least squares fit, where the mean represents the best fit line for both control and mutant data.
- 🔢 The design matrix, made up of ones and zeros, helps combine multiple lines into a single equation for easier computation.
- 🔬 Sum of squares of residuals around fitted lines is calculated similarly for both linear regression and t-tests, leading to an F value and p-value.
- 📊 ANOVA tests if all five categories are the same by calculating the sum of squares around the mean and fitted lines, then using design matrices to determine F values.
- ✅ Different design matrices can be used for t-tests and ANOVA, with more common ones available for standard use.
Q & A
What is the main topic of the video script?
-The main topic of the video script is General Linear Models, specifically focusing on how to apply linear regression techniques to perform t-tests and ANOVA using a design matrix.
What is a design matrix and why is it important in the context of this video?
-A design matrix is a matrix of zeros and ones that function as on and off switches for the means in a statistical model. It is important because it allows for the combination of multiple lines or means into a single equation, which simplifies the computation of F-values and p-values for t-tests and ANOVA.
Why is the overall mean used in the initial steps of the t-test?
-The overall mean is used to calculate the sum of squared residuals around the mean (SS mean), which is a preliminary step in understanding the variability in the data before fitting specific lines to different groups.
How does the process of fitting a line to the data differ between linear regression and t-tests in this script?
-In linear regression, a single line is fit to all the data using the least squares method. In contrast, for t-tests, separate lines (means) are fit to each group (e.g., control and mutant mice), and then these are combined into a single equation using a design matrix.
What is the purpose of calculating the sum of squared residuals around the fitted lines?
-Calculating the sum of squared residuals around the fitted lines helps to quantify the variability of the data points around the estimated means or lines. This is used in the calculation of the F-value, which is crucial for determining the statistical significance of the model.
How is the F-value calculated in the context of this script?
-The F-value is calculated using the sum of squares of the residuals around the mean (SS mean) and the sum of squares of the residuals around the fitted lines, along with the parameters p_mean (number of parameters in the equation for the mean) and p_fit (number of parameters in the equation for the fitted line).
What is the role of p-values in the context of t-tests and ANOVA as discussed in the script?
-P-values indicate the probability that the observed results are due to chance. A low p-value suggests that the means of different groups are significantly different from each other, which is the basis for rejecting the null hypothesis in t-tests and ANOVA.
What is the difference between the design matrix used in the script and the more common design matrix for t-tests and ANOVA?
-The design matrix used in the script is a simplified version created for the purpose of the tutorial, while the more common design matrix for t-tests and ANOVA has a different structure but serves the same purpose of facilitating the calculation of F-values and p-values.
Why is it important to fit the mean of each group separately in a t-test?
-Fitting the mean of each group separately allows for the comparison of group means to determine if there are statistically significant differences between them. This is the core of a t-test, which aims to assess whether the means of two groups are different from each other.
How does the script relate the concepts of linear regression to t-tests and ANOVA?
-The script demonstrates that the same mathematical techniques used in linear regression, such as calculating residuals and fitting lines, can be applied to t-tests and ANOVA by using a design matrix to handle multiple groups and their respective means.
What is the significance of the least squares fit in the context of the script?
-The least squares fit is significant as it provides the best estimate for the mean of each group in a t-test. It is used to minimize the sum of the squares of the residuals, which is a measure of the model's accuracy in predicting the data.
Outlines
📊 General Linear Models and T-tests with Design Matrix
This paragraph introduces the second part of a series on General Linear Models, focusing on applying linear regression techniques to perform t-tests and ANOVA. The video script explains the concept of a design matrix, which is essential for extending these techniques to more complex scenarios. It begins with a review of linear regression, including how to measure the usefulness of mouse weight for predicting mouse size using R-squared and p-values. The script then demonstrates how to apply these concepts to a t-test, comparing gene expression between control and mutant mice, with the goal of determining if the means are significantly different. The process involves calculating the sum of squared residuals, fitting lines to the data, and combining these lines into a single equation using the design matrix, which simplifies the computation of F and p-values.
🧬 Design Matrix Application in T-tests and ANOVA
The second paragraph delves deeper into the application of the design matrix in t-tests and ANOVA. It explains how to calculate the sum of squares of residuals around the fitted lines for both t-tests and ANOVA, emphasizing the role of the design matrix in simplifying the process. The script outlines the steps for calculating F and p-values, highlighting the importance of understanding p_mean and p_fit in the context of linear regression and t-tests. It also discusses the differences between the design matrix used in the video and the more common design matrix used in standard t-tests and ANOVA, setting the stage for further exploration in future StatQuest episodes.
📚 Conclusion and Future Outlook on StatQuest
The final paragraph wraps up the video script by summarizing the key points covered in the episode and providing a sneak peek into future content. It reviews the process of calculating the sum of squares around the mean and the fit, and how these values are used to compute F and p-values. The script also addresses the design matrix variations and their effectiveness in different statistical tests. The paragraph concludes with an invitation for viewers to subscribe for more StatQuest episodes and to share suggestions for future topics, encouraging continued engagement and learning.
Mindmap
Keywords
💡General Linear Models
💡Linear Regression
💡T-test
💡ANOVA
💡Design Matrix
💡Residuals
💡Sum of Squared Residuals
💡F-statistic
💡P-value
💡Degrees of Freedom
💡Gene Expression
Highlights
Introduction to StatQuest and General Linear Models, focusing on linear regression and its application to t-tests and ANOVA.
Explanation of how linear regression can be used to understand relationships between variables, such as predicting mouse size from mouse weight.
Introduction of the design matrix, a key concept that simplifies complex statistical models into a unified approach.
Step-by-step guide on how to use linear regression techniques to perform a t-test, comparing means of gene expression between control and mutant mice.
Detailing how to calculate the sum of squared residuals around the mean (SS mean) for both linear regression and t-tests.
Explanation of fitting lines to data, and how the mean acts as the least squares fit for both control and mutant data in the context of a t-test.
Combining equations for fitted lines using a design matrix, showing how to handle this computationally for a t-test.
Introduction of the abstract equation and design matrix, enabling a flexible approach to least squares problems.
Calculation of the sum of squares of residuals around the fitted lines for linear regression and t-tests.
Explanation of how to derive the F statistic and p-value from the calculated sums of squares for linear regression and t-tests.
Demonstration of ANOVA, testing differences across multiple categories (e.g., control and mutant mice on different diets).
Explanation of how to calculate the sum of squares around the mean and fitted lines for ANOVA, including determining parameters (p mean and p fit).
Introduction of the design matrix for ANOVA, detailing how it extends the concept used in t-tests.
Comparison of standard design matrices for t-tests and ANOVA, highlighting common and alternative forms.
Preview of future topics in StatQuest, focusing on more elaborate designs and practical applications of statistical methods.
Transcripts


5.0 / 5 (0 votes)
Thanks for rating: