Understanding Analysis of Variance (ANOVA) including Excel - Statistics Help
TLDRDr. Nick's video introduces Analysis of Variance (ANOVA), a statistical method for comparing means across more than two groups. Using real data on income and qualifications, he demonstrates how ANOVA calculates within-group variation and compares it to between-group variation, determining if differences in sample means are statistically significant in the population. The video covers hypothesis testing, assumptions of ANOVA, and the use of post-hoc tests to identify specific group differences. It also touches on nonparametric alternatives like the Kruskal-Wallis test when assumptions are violated.
Takeaways
- 📚 ANOVA, or Analysis of Variance, is a statistical method used to compare means across more than two groups.
- 📊 When comparing two means, a t-test is typically used, but ANOVA is necessary for three or more groups.
- 🔍 ANOVA assesses the variation within groups and compares it to the variation between groups, often with the help of computer software.
- 📈 The F-statistic is calculated in ANOVA and compared to the F-distribution to determine the p-value.
- 📈📉 The script provides an example using real data on annual incomes and qualifications, showing higher incomes for those with degrees.
- 📊 Data visualization, such as box and whisker plots, is recommended to understand the distribution and differences between groups.
- ❓ The null hypothesis in ANOVA states that the population means of all groups are equal, while the alternative hypothesis suggests at least one mean is different.
- 🔑 A statistically significant result (low p-value) leads to the rejection of the null hypothesis, indicating differences in the population means.
- 🔍📝 Post-hoc tests, like Tukey's test, are used to determine which specific pairs of means show significant differences.
- 📝 Excel and other statistical software can perform ANOVA, but Excel does not perform post-hoc tests.
- 🤔 Assumptions of ANOVA include independent samples, normal distribution of data, and equal variances across groups.
- 🚫 If ANOVA assumptions are violated, a nonparametric test like the Kruskal-Wallis test may be used as an alternative.
Q & A
What is the purpose of Analysis of Variance (ANOVA)?
-ANOVA is used to compare means across more than two groups. It helps determine if there are statistically significant differences between the group means.
Why is ANOVA preferred over a t-test when comparing multiple groups?
-A t-test is used for comparing the means of two groups. ANOVA is the appropriate method when there are more than two groups, as it accounts for the variance both within and between the groups.
How does ANOVA calculate the variation within and between groups?
-ANOVA calculates the variation within each group by assessing the differences among the data points within the same group. It then compares this to the variation between groups, which is the differences among the group means.
What is the F-statistic in ANOVA, and what is it used for?
-The F-statistic is a value calculated in ANOVA that represents the ratio of the variance between groups to the variance within groups. It is used to determine if the differences between group means are statistically significant.
How is the p-value derived from the F-statistic in ANOVA?
-The p-value is derived by comparing the calculated F-statistic to the F-distribution. If the F-statistic is large enough to fall in the tail of the F-distribution, the p-value is small, indicating a statistically significant result.
What does a small p-value in ANOVA signify?
-A small p-value, typically less than 0.05, indicates strong evidence against the null hypothesis, suggesting that there is a statistically significant difference between at least one of the group means.
What is the null hypothesis in ANOVA, and what does it represent?
-The null hypothesis in ANOVA (H0) states that the population means of all groups are equal. It represents the assumption of no difference among the group means before any statistical testing is conducted.
What is the alternative hypothesis in ANOVA, and what does it imply?
-The alternative hypothesis in ANOVA suggests that at least one group mean is different from the others. It implies that there is a difference among the group means that warrants further investigation.
What is a post-hoc test, and why is it used after ANOVA?
-A post-hoc test is used after ANOVA to determine which specific group means are significantly different from each other. It is used because ANOVA only tells us that there is a difference among the means, not which means differ.
What are some assumptions underlying the ANOVA test, and why are they important?
-Assumptions of ANOVA include the independence of samples, normal distribution of data, and homogeneity of variances among groups. These assumptions are important because if they are violated, the results of ANOVA may not be valid, and alternative non-parametric tests like the Kruskal-Wallis test may be needed.
What is the Kruskal-Wallis test, and when might it be preferred over ANOVA?
-The Kruskal-Wallis test is a non-parametric test used when the assumptions of ANOVA are not met, such as when the data is not normally distributed or the variances among groups are significantly different. It does not assume a specific distribution of the data and can be a more robust alternative.
Outlines
📊 Introduction to ANOVA and its Application
Dr. Nick introduces the concept of Analysis of Variance (ANOVA), a statistical method used to compare the means of more than two groups. He explains that while t-tests are used for two groups, ANOVA is necessary for three or more. The process involves calculating the variation within groups and comparing it to the variation between groups. Dr. Nick uses an example of annual incomes and qualifications, illustrating the differences with box and whisker plots. He emphasizes the importance of graphing data and setting up hypotheses to determine if the differences observed in the sample are statistically significant in the population. The null hypothesis is that all group means are equal, and the alternative hypothesis is that at least one mean is different. The significance of the p-value in hypothesis testing is also discussed, with a focus on rejecting the null hypothesis when the p-value is low.
🔍 Post-Hoc Testing and ANOVA Assumptions
This paragraph delves into the implications of a statistically significant result from an ANOVA test. Dr. Nick discusses the use of post-hoc tests, such as Tukey's test, to determine which group means differ significantly. He presents the output from a statistical software package, showing that all pairs of means, except for the 'school' and 'vocational' groups, are significantly different. The paragraph also addresses the assumptions underlying the ANOVA test, including the independence of samples, normal distribution of data, and homogeneity of variances. Dr. Nick notes that if these assumptions are violated, a nonparametric test like the Kruskal-Wallis test may be more appropriate. He concludes by emphasizing the importance of thorough analysis and invites viewers to share their thoughts and suggestions in the comments.
Mindmap
Keywords
💡ANOVA
💡t-test
💡Variation
💡F-statistic
💡p-value
💡Null Hypothesis (H0)
💡Alternative Hypothesis
💡Box and Whisker Plots
💡Post Hoc Test
💡Assumptions of ANOVA
💡Kruskal-Wallis Test
Highlights
Dr. Nick introduces the concept of Analysis of Variance (ANOVA) for comparing means across more than two groups.
ANOVA calculates the variation within groups and compares it to the variation between groups.
The F statistic and its associated p-value are used to determine if the differences in means are statistically significant.
Excel is utilized to create comparative box and whisker plots to visualize data distribution across different qualification groups.
People with degrees tend to earn more than those without, as shown in the sample data.
The sample means are different, prompting the question of whether this difference is due to sampling variation or a true population difference.
The null hypothesis (H₀) states that the population means of all groups are equal.
The alternative hypothesis suggests that at least one group mean differs from the others.
ANOVA results from Excel show a significant F value and an extremely low p-value, indicating a statistically significant difference.
A post-hoc test, such as a Tukey test, is used to determine which specific pairs of means differ significantly.
Descriptive statistics output from DeSP shows statistically significant differences between all pairs of means except for the school and vocational groups.
There are underlying assumptions for ANOVA, including independence of samples, normal distribution of data, and homogeneity of variances.
If assumptions are violated, a nonparametric test like the Kruskal-Wallis test may be used as an alternative.
The sample data shows some violation of assumptions, with notably different variances and group sizes.
The Kruskal-Wallis test confirms the significance of the findings, aligning with the parametric ANOVA results.
The video concludes with a summary of one-way ANOVA and its interpretation, encouraging viewers to share their interests for future content.
Dr. Nick invites viewers to like, subscribe, and join the channel to support its growth and educational mission.
Transcripts
Browse More Related Video
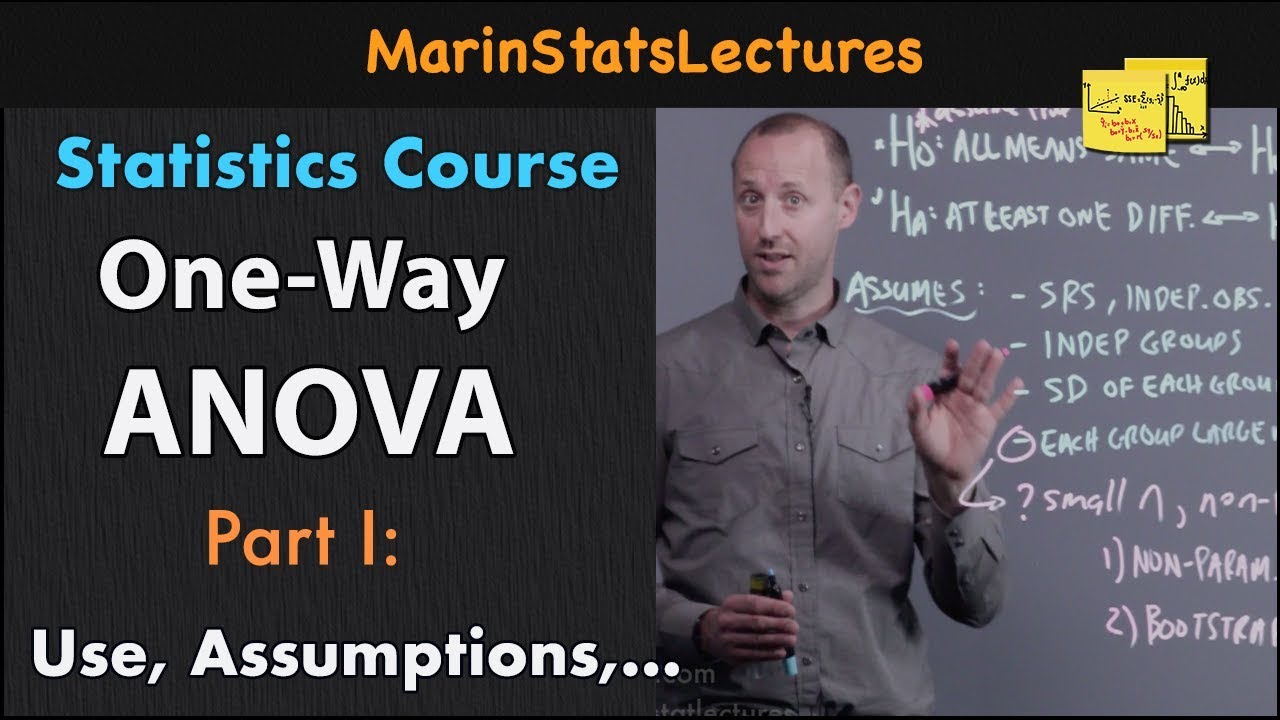
One Way ANOVA (Analysis of Variance): Introduction | Statistics Tutorial #25 | MarinStatsLectures

SPSS (9): Mean Comparison Tests | T-tests, ANOVA & Post-Hoc tests

ANOVA (Analysis of variance) simply explained

Statistics 101: ANOVA Post Hoc Test (Fisher's LSD)
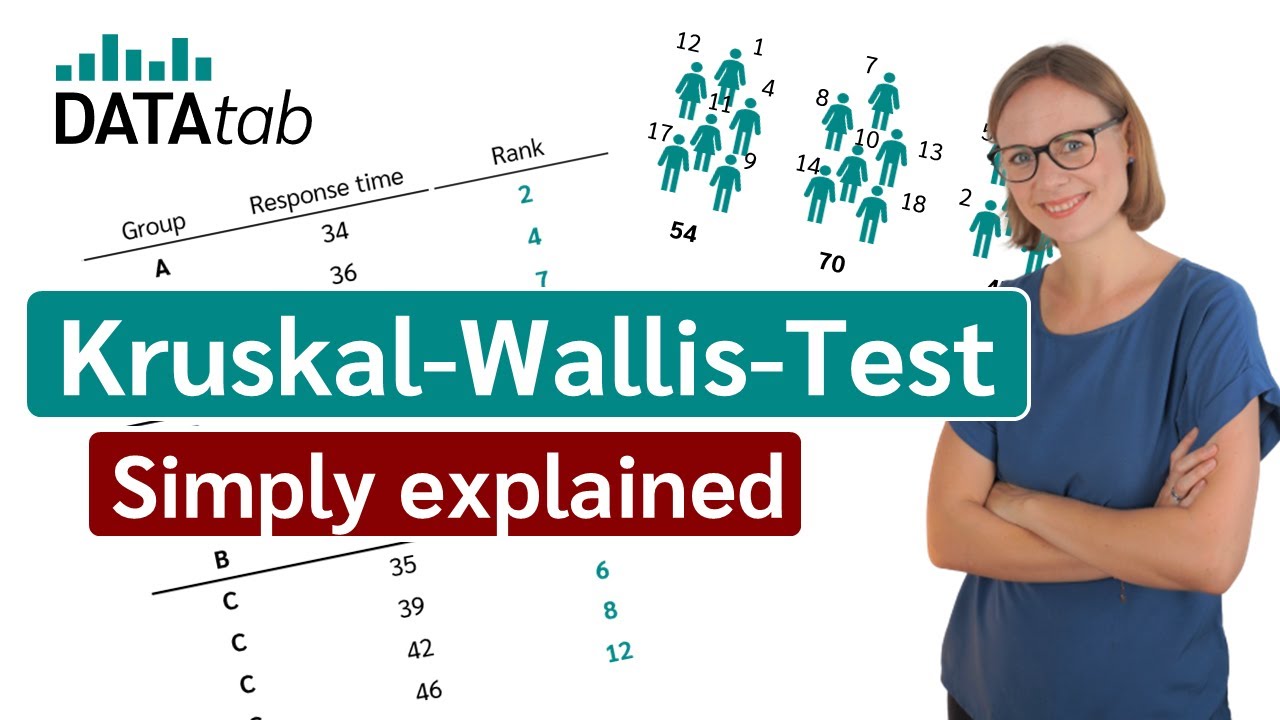
Kruskal-Wallis-Test (Simply explained)
How to Run One Way ANOVA in SPSS: Concept, Interpretation, and Reporting One Way ANOVA
5.0 / 5 (0 votes)
Thanks for rating: