Degrees of Freedom and Effect Sizes: Crash Course Statistics #28
TLDRThis video discusses key concepts in statistics like p-values, effect sizes, and degrees of freedom. It explains how p-values indicate statistical significance but don't give the full picture. Effect sizes help determine practical significance by comparing the effect to normal variation. Degrees of freedom relate to the amount of independent data and influence the shape of t-distributions. Together, these concepts provide context for statistical tests like t-tests and determine whether results are significant and meaningful.
Takeaways
- 📚 Degrees of freedom represent the number of independent pieces of information in our data, crucial for statistical modeling.
- 🧠 Effect size is key to understanding the practical significance of statistical results, complementing p-values.
- 📈 The t-distribution is used instead of the z-distribution when the population standard deviation is unknown, incorporating sample standard deviation estimates.
- 📝 Sample size impacts the t-distribution's shape, with larger samples leading to a distribution closer to the normal z-distribution.
- 🔥 Degrees of freedom are reduced by one for each parameter estimated, such as calculating a mean, affecting the freedom of data to vary.
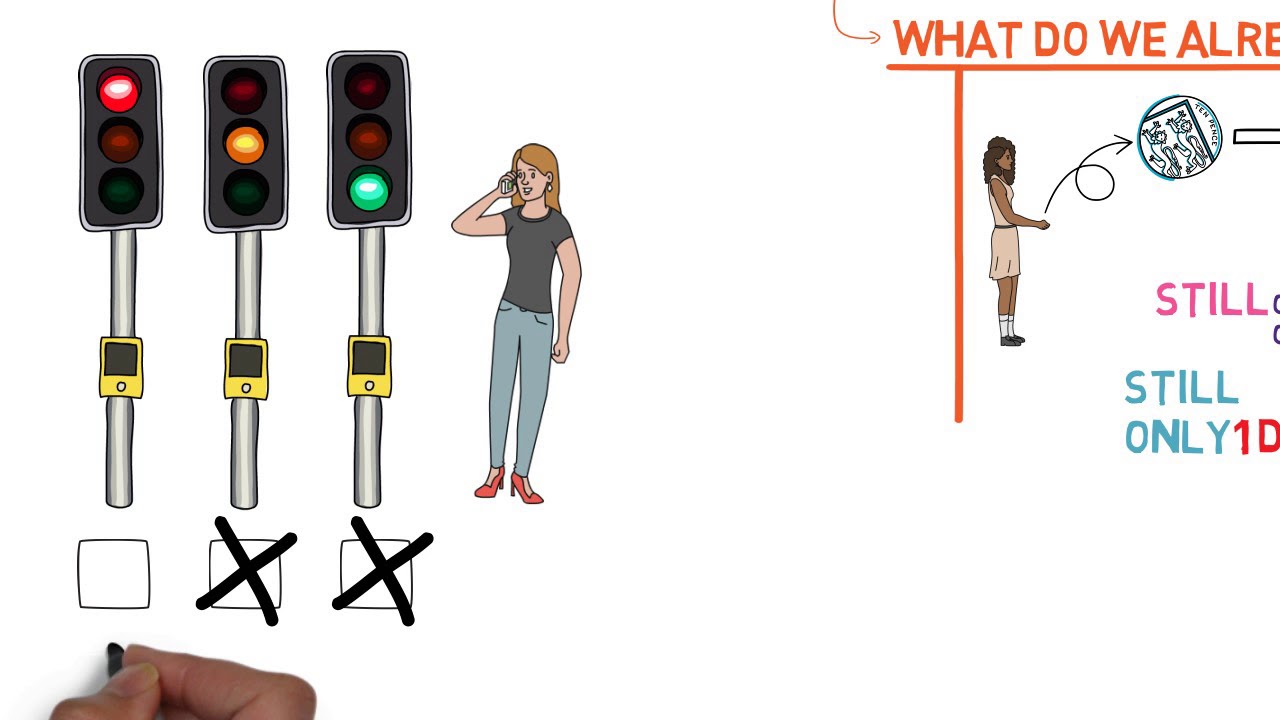
- 🌱 The script uses an analogy of credit card numbers to illustrate how knowledge of certain information can restrict degrees of freedom.
- 📉 Statistical significance doesn't always imply practical significance, highlighting the importance of considering effect size.
- 📊 Larger sample sizes can lead to more statistically significant results but don't necessarily affect the effect size.
- 📅 The concept of degrees of freedom is vital for choosing the appropriate t-distribution for calculating p-values.
- 💼 Real-world examples, like the WOWZERBRAIN! intervention, show how statistical analysis can guide practical decisions.
Q & A
What are degrees of freedom in the context of statistics?
-Degrees of freedom refer to the number of independent pieces of information in a dataset that are available to estimate another statistic. It's a concept that helps measure the amount of information used in a calculation, such as when calculating a sample mean, which uses up one degree of freedom.
How does the concept of degrees of freedom relate to choosing a t-distribution for a t-test?
-The choice of t-distribution for calculating a p-value in a t-test is based on the number of degrees of freedom in the dataset. Degrees of freedom influence the shape of the t-distribution, with more degrees of freedom making the t-distribution closer to a normal (z) distribution.
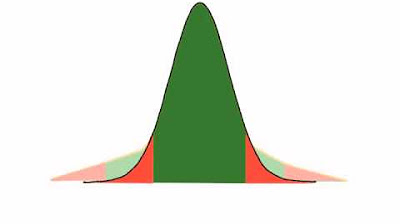
Why does the t-distribution have fatter tails compared to the z-distribution?
-The t-distribution has fatter tails because there is more uncertainty in estimating the population standard deviation from a sample, compared to when the population standard deviation is known. This additional uncertainty makes extreme t-values slightly more likely than in the z-distribution.
How does sample size affect the shape of the t-distribution?
-As the sample size (n) increases, the t-distribution becomes less uncertain about the estimate of the population parameters, and its shape gets closer to that of the z-distribution. Larger sample sizes provide more accurate estimates, leading to a narrower distribution.
What is effect size, and why is it important in the context of a t-test?
-Effect size measures how large the observed effect is in comparison to random variation. It provides context to p-values by indicating whether the statistically significant results are also practically significant, helping to determine the usefulness of the findings.
How can knowing the mean of a set of numbers without individual values illustrate the concept of degrees of freedom?
-Knowing the mean constrains the possible values of individual numbers in a set, reducing the degrees of freedom. For example, if the mean of three numbers is known, and then two of the numbers are revealed, the third can be determined exactly, showing how degrees of freedom limit the range of independent information.
Why might a statistically significant result not be practically significant?
-A statistically significant result may not be practically significant if the effect size is small relative to the variability in the data or the context of the study. This means that while the result is unlikely to have occurred by chance, the actual impact or difference observed may not be meaningful or useful in real-world applications.
What role does sample size play in determining the power of a statistical test?
-Sample size directly affects the power of a statistical test, with larger sample sizes reducing the standard error, increasing the t-statistic, and thus enhancing the ability to detect an effect if one exists. Larger samples provide more accurate estimates and can lead to statistically significant results even for small effect sizes.
In the credit card example, how does the concept of degrees of freedom apply?
-In the credit card example, degrees of freedom are illustrated by the number of independent pieces of information (credit card numbers) that can vary freely. Once the mean and two of the three numbers are known, the third number has no freedom to vary, highlighting how degrees of freedom decrease as information is used.
Why is it important to pair p-values with effect sizes when interpreting statistical results?
-Pairing p-values with effect sizes is important because p-values alone only indicate the likelihood of observing the data if the null hypothesis were true, without indicating the size or importance of the effect. Effect sizes provide a measure of the practical significance of the results, offering a more complete understanding of the data.
Outlines
📊 Understanding Degrees of Freedom and Effect Size in Statistics
Adriene Hill introduces the concept of limiting choices to achieve productivity, using an analogy of a team project to explain how roles assigned limit the last person's choice, paralleling the concept of degrees of freedom in statistics. Degrees of freedom represent the number of independent pieces of information in a dataset, crucial for making useful calculations with data. The script also introduces the concept of effect size in the context of t-tests, highlighting its importance for understanding the context and significance of test results. Through the analogy of splitting a bill among friends, the video script explains how degrees of freedom work in practice, emphasizing that calculating an average (mean) uses up one piece of independent information, thereby reducing the degrees of freedom by one.
🔍 Statistical Significance vs. Practical Significance in Data Analysis
This paragraph expands on the application of degrees of freedom in statistical analysis, using a study of bee populations in avocado orchards as an example. It explains how the calculation of means and other statistics uses up degrees of freedom, affecting the shape of the t-distribution used to calculate p-values. The narrative highlights the importance of considering both statistical significance and effect size when interpreting data. A significant increase in bee population is used to illustrate statistical significance, while discussions on the practical implications of such findings, like the effectiveness of bee pheromones, underscore the importance of considering effect size for practical decision-making.
📚 The Role of Sample Size in Detecting Statistical Effects
The third paragraph discusses the influence of sample size on detecting statistical effects, using the hypothetical WOWZERBRAIN! educational supplement as a case study. It explains how a larger sample size can reduce standard error, potentially leading to statistically significant results even when effect sizes are small. This section emphasizes the difference between statistical significance and practical significance, illustrating how an increase in sample size can lead to the rejection of the null hypothesis but may still result in an effect size that lacks practical significance. The script concludes with a discussion on the comprehensive approach to data analysis, incorporating p-values, effect sizes, and degrees of freedom to accurately interpret and apply statistical findings.
Mindmap
Keywords
💡p-value
💡effect size
💡statistical significance
💡sample size
💡degrees of freedom
💡t-test
💡t-statistic
💡standard error
💡t-distribution
💡hypothesis testing
Highlights
The speaker introduces the topic of using AI to analyze meeting transcripts.
They explain their motivation is to help people be more productive in meetings by creating tools to search and summarize key discussion points.
They describe their approach of using natural language processing techniques like named entity recognition and coreference resolution to extract important entities from the transcripts.
They share an example of how their system was able to automatically detect the key decisions made in a meeting by analyzing the transcript.
They discuss the challenges of parsing informal conversational speech and dealing with disfluencies like filler words and interruptions.
They present quantitative results showing their model achieves over 80% accuracy on extracting key entities and decisions compared to human annotations.
They highlight the usefulness of being able to search transcripts for specific mentions of people, topics, action items, and decisions.
They share user feedback that the transcript summaries help participants recall important discussions and stay aligned on action items after meetings.
They discuss limitations of current techniques for modeling conversational nuances and suggest future work on incorporating pragmatic and discourse information.
They conclude by reiterating the potential of AI for improving collaboration, productivity, and knowledge management through automated analysis of meetings.
During the Q&A, they explain challenges in deploying meeting transcription systems in real-world environments like handling overlapping voices.
An audience member asks about privacy concerns with recording meetings, and they respond by discussing mitigation strategies.
They note recent advances in on-device speech recognition that allow transcript generation without sending audio data to the cloud.
In response to a question, they suggest ways to make meeting transcription more accessible like providing real-time captioning.
They wrap up by emphasizing the importance of centering human needs as we design AI systems to enhance workplace communication and collaboration.
Transcripts


5.0 / 5 (0 votes)
Thanks for rating: