T-Tests: A Matched Pair Made in Heaven: Crash Course Statistics #27
TLDRThis video explains how to use statistical tests like t-tests to analyze data and draw conclusions. It starts with an example testing two coffee shops, then explains how to set up hypotheses, calculate test statistics and p-values, determine significance, and interpret results. It highlights how the same core logic underlies different scenarios like matched pairs vs independent samples. The video aims to demystify statistics, showing how following a systematic process helps reveal patterns amid variability.
Takeaways
- 📊 The general formula for test statistics allows for versatility in statistical testing, reducing the need to memorize numerous formulas for different situations.
- 🔍 A two-sample t-test (independent or unpaired t-test) is used to compare the means of two groups to see if there's a statistically significant difference between them.
- 📉 The process involves calculating a t-statistic from the observed difference in means and comparing it to a critical value or calculating a p-value to decide on rejecting the null hypothesis.
- 🎯 The null hypothesis typically posits no difference between the groups, while the alternative hypothesis suggests a significant difference exists.
- 🔑 Choosing an alpha level (commonly 0.05) sets the threshold for what is considered statistically significant, influencing the decision to reject the null hypothesis.
- 📐 The standard error, accounting for sample variance, is crucial in calculating the t-statistic for two-sample t-tests.
- 🚫 Failing to reject the null hypothesis indicates no statistically significant difference was found, not necessarily that no difference exists.
- 🔄 A paired t-test can be more appropriate when comparing the same subjects under two different conditions, minimizing variability not related to the treatment effect.
- 💡 The importance of experimental design is highlighted, showing how matching or pairing subjects can reduce variability and improve the reliability of results.
- 🔬 Statistical tests and principles are tools for understanding and interpreting variability, helping to distinguish between real effects and random chance.
Q & A
What is the purpose of the coffee shop experiment?
-The purpose is to determine if there is a statistically significant difference in coffee quality between two popular local coffee shops, Caf-fiend and The Blend Den.
What are the null and alternative hypotheses in the first coffee experiment?
-The null hypothesis is that there is no difference between the two coffee shops. The alternative hypothesis is that there is a difference - one coffee shop is better than the other.
How did the first experiment account for individual coffee preferences?
-The first experiment did not account for individual coffee preferences. This likely introduced additional variability into the analysis.
How did the second paired experiment account for individual preferences?
-By having the same people rate both coffees, individual preferences were accounted for. Taking the difference in scores for each person removed this additional source of variability.
What was the mean difference in coffee scores between Caf-fiend and The Blend Den?
-In the second paired experiment, the mean difference was -0.18125. On average, The Blend Den scored 0.18125 points higher.
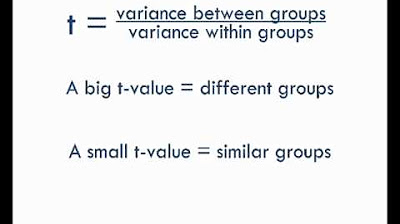
What does the t-statistic represent?
-The t-statistic tells you how many standard errors the observed mean difference is away from the expected mean difference under the null hypothesis. So it quantifies the likelihood of getting our results by chance.
What would make you more confident in the results?
-A larger sample size would make the results more confident. Repeating the experiment multiple times would also increase confidence that the finding is real.
Could you use statistics to determine if certain music damages hearing?
-Yes, you could design an experiment that exposed people to different music volumes and measured any change in hearing over time. Appropriate statistical tests could determine if loud music causes more hearing damage.
What is the purpose of an alpha level in hypothesis testing?
-The alpha level sets the threshold for how unlikely our results need to be under the null hypothesis before we will reject it. Typical values like 0.05 mean we'll reject the null if there's only a 5% chance of getting our data.
What is Cream and why was it mentioned?
-Cream was a 1960s blues rock band known for loud music that could potentially damage hearing. They were given as an example of musicians you could study in an experiment about music volume and hearing loss.
Outlines
😃 Introducing the video topic and episode overview
The host Adriene Hill introduces herself and the video series Crash Course Statistics. She explains that this episode will build on the previous one about test statistics and cover how a general formula can be adapted to create statistics for different situations.
☕️ Conducting an experiment to compare two coffee shops
The host describes an experiment to determine which of two popular local coffee shops has better coffee. She gave samples from each shop to a random sample of friends, who rated the coffee on a scale. The Blend Den scored slightly higher. She calculates a t-statistic to determine if the difference is significant.
💡 Improving the experiment with paired testing
The host realizes her experiment could be improved by accounting for personal coffee preferences. She describes conducting a paired t-test by having the same people rate both coffees. This time, The Blend Den scored significantly higher. She explains how t-statistics indicate the number of standard deviations from the mean.
☕ Conclusion and key takeaways
The host concludes that paired testing helped reveal the better coffee shop by reducing variability. She summarizes that statistics is about comparing observations to expectations to uncover patterns, a process they now have tools for. The video ends thanking viewers and previewing future episodes.
Mindmap
Keywords
💡hypothesis testing
💡p-value
💡t-statistic
💡paired vs. unpaired t-test
💡statistical significance
💡Type I and Type II errors
💡standard error
💡experimental design
💡confounding variables
💡statistical power
Highlights
The speaker introduces the concept of using AI to generate realistic synthetic data.
They explain how synthetic data can help address issues with insufficient real-world datasets.
They discuss techniques like generative adversarial networks that can create realistic synthetic images.
They note synthetic data is useful for anomaly detection by training models on normal data.
The speaker highlights synthetic data can help balance datasets and mitigate bias issues.
They explain challenges with evaluating whether synthetic data models capture true distributions.
They discuss the need for caution around potential misuse of synthetic data generation.
The speaker introduces data augmentation as a simpler alternative to synthetic data generation.
They note regulatory challenges as synthetic data gets more realistic.
They emphasize synthetic data is a rapidly evolving field with active research.
The speaker summarizes key takeaways and benefits of synthetic data done responsibly.
They conclude by forecasting the potential transformative impact of synthetic data.
During Q&A they recommend starting simple with synthetic data for initial proofs of concept.
They reiterate responsible use cases as focus areas for synthetic data research.
The speaker closes by emphasizing the importance of ethics and transparency with synthetic data.
Transcripts
Browse More Related Video
StatsCast: What is a t-test?

t-Test - Full Course - Everything you need to know
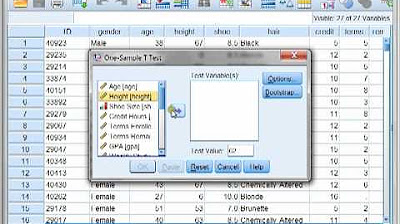
Three Different t tests using SPSS with Dr Ami Gates

T-test, ANOVA and Chi Squared test made easy.

Degrees of Freedom and Effect Sizes: Crash Course Statistics #28
Permutation Hypothesis Test in R with Examples | R Tutorial 4.6 | MarinStatsLectures
5.0 / 5 (0 votes)
Thanks for rating: