Test Statistics: Crash Course Statistics #26
TLDRThis video explains test statistics, which allow us to quantify whether observed data fits a null hypothesis or if differences are due to random variation. Concepts covered include z-scores, sampling distributions, z-tests, t-tests, standard error, p-values, and more. Examples demonstrate how to calculate test statistics and determine if results are statistically significant in contexts like IQ scores, vaccine effectiveness, and car repair shop wait times.
Takeaways
- 😀 Test statistics quantify differences between data and expectations, adding mathematical rigor to determine if differences are real or random
- 👩🏫 Z-scores help understand relative differences based on context like variation in groups
- 📊 Z-statistics indicate how many standard errors a sample mean is from a distribution mean
- 🔢 Z-tests and t-tests use test statistics to conduct hypothesis tests about means, differences, proportions
- 📈 T-tests use estimated population standard deviations when the true value is unknown
- 🚦 Critical values and p-values both identify extreme, statistically significant results
- 🤔 P-values help compare results across test statistics like z, t, F, chi-square
- 🧪 Test statistics form the basis for assessing if results are within normal variation or if something interesting is happening
- ⚖️ Equivalent methods like critical values and p-values should lead to the same conclusions about results
- 🧬 Test statistics lay the foundation for experiments to determine causality like which hiccup remedies work best
Q & A
What do test statistics allow us to quantify?
-Test statistics allow us to quantify how close things are to our expectations or theories. They help us determine if an observed difference is just due to random variation or if it represents a real difference.
Why is variance important when judging a difference between groups?
-The amount of variance in a group is important for determining if an observed difference between groups is meaningful. If there is a lot of natural variation within the groups, a small difference between group means may not be meaningful.
What is a z-score and what does it tell us?
-A z-score tells us how many standard deviations an observed value is away from the mean. It allows us to quantify whether our observed data point is typical or extreme compared to a population.
How do we calculate a z-score for a group mean?
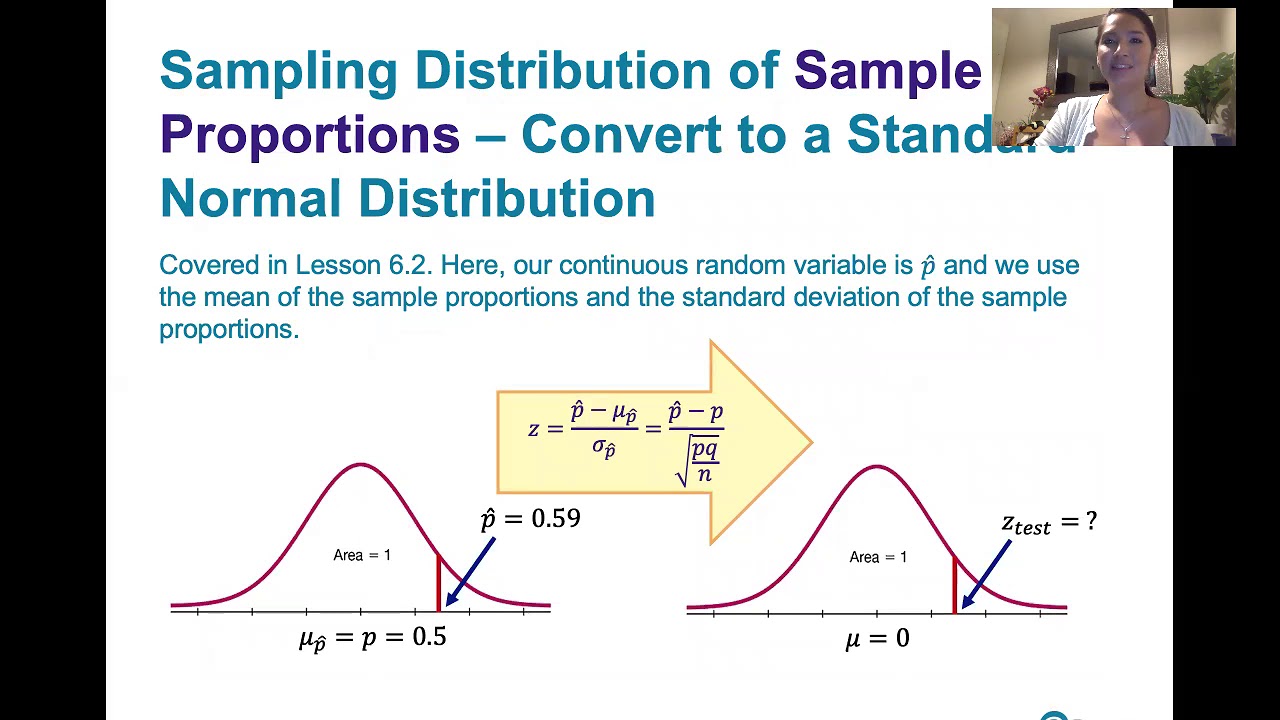
-To calculate a z-score for a group mean, subtract the mean of our sampling distribution under the null hypothesis and divide by the standard error (the standard deviation of the sampling distribution of sample means).
When do we use a t-test instead of a z-test?
-We use a t-test when we don't know the true population standard deviation. The t-test uses the sample standard deviation in its calculation rather than the population standard deviation.
How are critical values and p-values related?
-Critical values and p-values are equivalent methods for deciding whether to reject the null hypothesis. A test statistic more extreme than critical values and a p-value less than the significance level will both lead to rejecting the null.
What do the thicker tails in a t-distribution represent?
-The t-distribution's thicker tails represent more uncertainty since we are estimating the population standard deviation from the sample data. The thicker tails mean extreme values are more common.
What information do we need to conduct a two-sample t-test?
-To conduct a two-sample t-test, we need the means and standard deviations of two groups, the sample size in each group, the hypothesized difference between means under the null hypothesis, and the significance level.
How can test statistics help us determine if something is random variation or a real difference?
-By quantifying an observed difference relative to the amount of variation we'd expect by chance, test statistics allow us to calculate p-values that tell us how likely our results would be under just random variation. Extreme p-values provide evidence of real differences.
What are some examples of using test statistics in real life?
-We could use test statistics to determine if there is a real difference in wait times between two auto shops, effectiveness of a flu vaccine, IQ differences between groups of children, or speed of hiccup cures.
Outlines
😊 Introducing Test Statistics
Test statistics allow us to quantify differences and determine if they are due to chance or represent a real effect. They account for natural variation and add mathematical rigor. Z-scores helped establish the idea that differences are relative based on context. Test statistics build on this by comparing observed differences to expected differences under the null hypothesis.
😀 Calculating and Interpreting Z-scores
Z-scores and z-tests allow hypothesis testing for means, mean differences, proportions, and proportion differences. They standardize an observed difference by the standard error from the sampling distribution. Z-scores near -1 to 1 are typical, while large magnitudes indicate rare/extreme values. P-values help assess rarity to determine significance.
🤓 When To Use T-Tests Instead
T-tests are appropriate when the population standard deviation is unknown. The t-distribution is similar to the z-distribution but with fatter tails due to estimating the SD. As sample size grows, t converges to z. T-tests can compare means between groups, like wait times at two auto shops.
Mindmap
Keywords
💡test statistics
💡null hypothesis
💡z-score
💡standard error
💡t-test
💡p-value
💡statistically significant
💡hypothesis test
💡critical value
💡alpha level
Highlights
Test statistics allow us to quantify how close things are to our expectations or theories.
Test statistics help us quantify whether data fits our null hypothesis well.
Z-statistics around 1 or -1 tell us that the sample mean is the typical distance we’d expect a typical sample mean to be from the mean of the null hypothesis.
If your z-statistic is more extreme than the critical value, you call it “statistically significant”.
The t-test is just like our z-test. It uses the same general formula for its t-statistic.
The t-distribution looks like the z-distribution, but with thicker tails.
Estimation adds a little more uncertainty ...which means thicker tails, since extreme values are a little more common.
If we’re ever in a situation where we had the population standard deviation, a z-test is the way to go.
We collect data from 50 customers who need to take their cars in for major repairs.
We set our alpha at 0.01, because we want to be a bit more cautious about rejecting the null hypothesis.
It might have seemed like the larger repair shop was definitely going to be faster but, it’s actually not so clear.
You might notice that throughout the examples in this episode, we used two methods of deciding, whether something was significant: critical values and p-values.
If you have trouble remembering it, this rhyme may help: “Reject H-Oh if the p is too low”
Test statistics form the basis of how we can test if things are actually different or what, we seeing is just normal variation.
Like whether drinking that water upside down is actually stopping your hiccups faster, than doing nothing.
Transcripts
Browse More Related Video
8.1.3 Basics of Hypothesis Testing - Computing and Interpreting Test Statistics
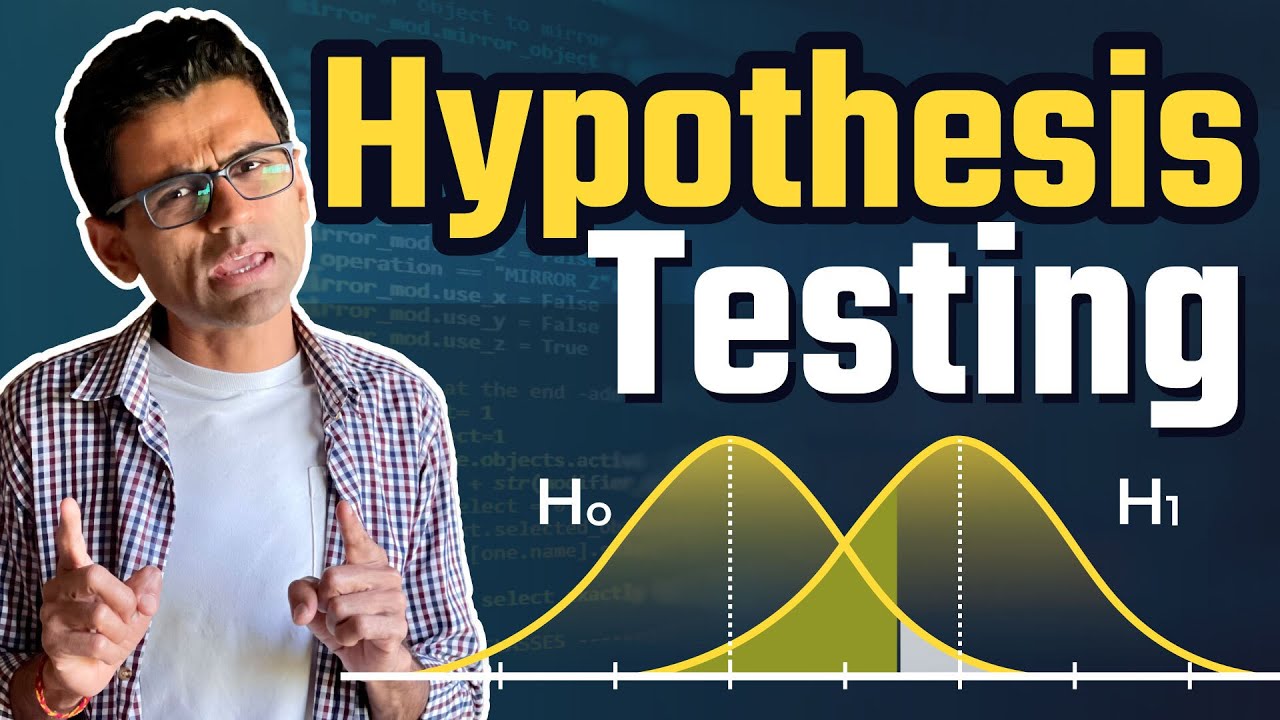
What is Hypothesis Testing ? Math, Statistics for data science, machine learning

Degrees of Freedom and Effect Sizes: Crash Course Statistics #28

P-Value Problems: Crash Course Statistics #22

P-values and significance tests | AP Statistics | Khan Academy
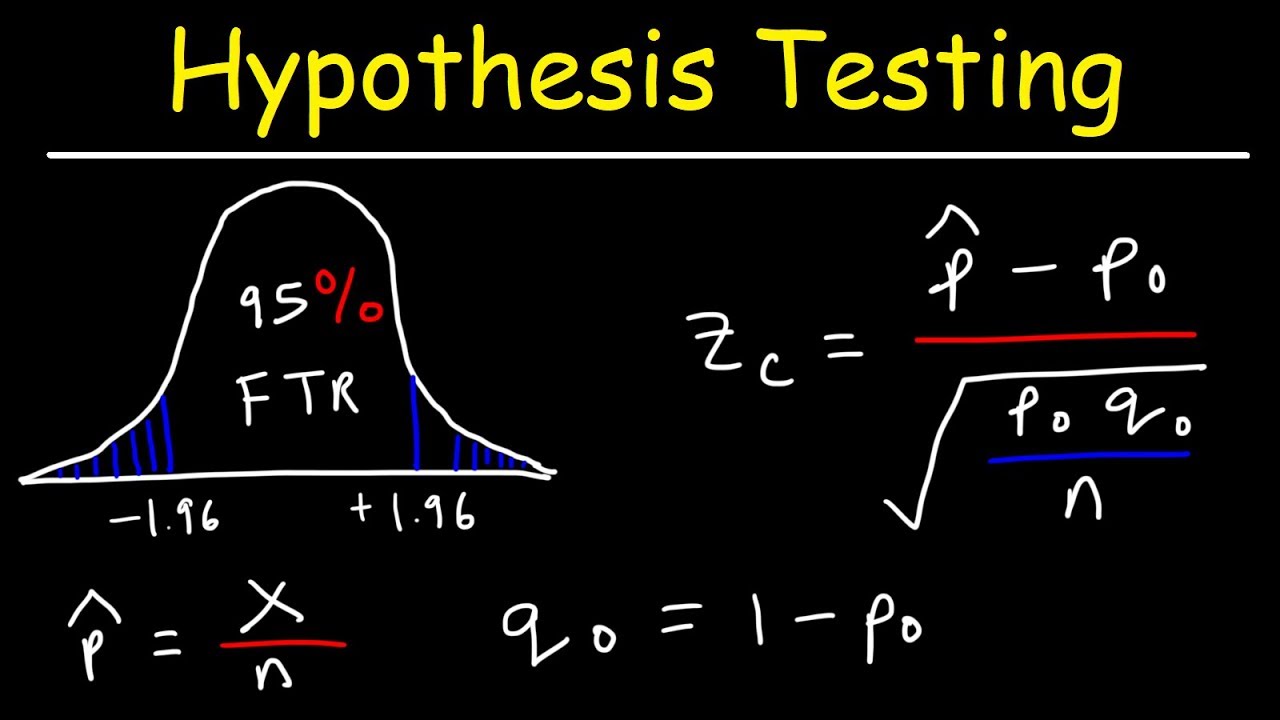
Hypothesis Testing - Solving Problems With Proportions
5.0 / 5 (0 votes)
Thanks for rating: