How to calculate t distributions
TLDRThis tutorial delves into the T distribution, highlighting its historical significance in improving Guinness beer by William Gossett. The T distribution is compared to the normal distribution, illustrating its 'shorter and fatter' bell curve shape, particularly with small sample sizes. As sample size increases, the T distribution increasingly resembles the normal distribution, becoming identical for large samples (greater than 20). The concept of degrees of freedom, calculated as sample size minus one, is introduced, showing how it affects the critical T score for hypothesis testing. The tutorial also explains the two-tailed test, the significance of the 95% acceptance area, and the concept of alpha and p-values in statistical analysis.
Takeaways
- 🍺 The T distribution was developed by William Gossett, who used it to improve the quality of Guinness beer.
- 📊 The T distribution is similar to the normal distribution, but it is shorter and wider, especially with smaller sample sizes.
- 🔍 In a two-tailed test, 95% of the data falls within the acceptance region, with 2.5% in each tail (rejection region).
- 📉 The Z-scores for a 95% confidence level are ±1.96 standard deviations from the mean.
- 🔑 The T distribution's critical values change with the sample size; with very small samples, the T scores are much larger in magnitude.
- ⚖️ As the sample size increases, the T distribution more closely resembles the normal distribution.
- 📚 At sample sizes greater than 20, the T distribution is nearly identical to the normal distribution for most practical purposes.
- 🔢 Degrees of freedom (DF) in the context of the T distribution is calculated as the sample size minus one.
- 📉 For small sample sizes, the critical T value from the distribution table is used to determine the rejection region.
- 🔴 The critical value for the T distribution approaches 1.96 as the sample size goes to infinity, which is the same as the Z-score for a normal distribution.
- 📈 The T distribution is particularly useful for hypothesis testing with small sample sizes where the population standard deviation is unknown.
Q & A
What is the T distribution and how is it related to the z-score?
-The T distribution, also known as Student's t-distribution, is a probability distribution that is used in inferential statistics, particularly when the sample size is small and the population standard deviation is unknown. It is similar to the z-score in that both are used to determine the likelihood of a statistical result under the null hypothesis, but the T distribution accounts for the additional uncertainty that comes with smaller sample sizes.
Who is William Gossett and why is he significant in the history of the T distribution?
-William Gossett was a statistician who worked for the Guinness brewery in the early 20th century. He is significant because he developed the T distribution, which he used to improve the quality of Guinness beer. His work led to the statistical method being known as Student's t-test, as he published his findings under the pseudonym 'Student'.
What is meant by a 'two-tailed test' in the context of statistical hypothesis testing?
-A two-tailed test is a type of hypothesis test in which the rejection region is divided equally between the two tails of a distribution. This means that there is an equal probability of committing a Type I error in either tail. In the context of the normal distribution, a two-tailed test with a significance level of 5% would have 2.5% in each tail as rejection regions.
What is the significance of the alpha level in hypothesis testing?
-The alpha level (α) is the probability of rejecting the null hypothesis when it is true. It is often set at 0.05, which means there is a 5% chance of a Type I error, or a false positive. The alpha level determines the critical values that define the rejection region in a statistical test.
What are Z scores and how do they relate to standard deviations from the mean?
-Z scores are standard scores that indicate the number of standard deviations a data point is from the mean of a distribution. They are used to standardize data points so that they can be compared across different scales. A Z score of 1.96, for example, means that the data point is 1.96 standard deviations above the mean.
How does the shape of the T distribution compare to the normal distribution?
-The T distribution is similar in shape to the normal distribution, resembling a bell curve. However, it is 'shorter' and 'fatter,' meaning it has heavier tails and is more spread out than the normal distribution. This shape is more pronounced with smaller sample sizes and becomes less so as the sample size increases.
What happens to the T distribution as the sample size increases?
-As the sample size increases, the T distribution becomes more like the normal distribution. This convergence occurs because with larger sample sizes, the additional uncertainty associated with small sample sizes is reduced. Specifically, for sample sizes greater than 20, the T distribution and the normal distribution are effectively the same.
What are degrees of freedom and how are they calculated in the context of the T distribution?
-Degrees of freedom (DF) in the context of the T distribution refer to the number of independent values that can vary in the calculation of a statistic. For the T distribution, the degrees of freedom are calculated as the sample size minus one (DF = sample size - 1). This is because one degree of freedom is lost in estimating the mean from the sample data.
How does the critical T value change with different degrees of freedom?
-The critical T value changes inversely with the degrees of freedom. As the degrees of freedom increase (which corresponds to larger sample sizes), the critical T value decreases. For very large sample sizes (greater than 100), the critical T value converges to 1.96, which is the same as the critical Z value for a normal distribution.
What is the significance of the 95% acceptance area in a two-tailed test?
-The 95% acceptance area in a two-tailed test signifies the region under the probability distribution curve where the null hypothesis is not rejected. This means that 95% of the data falls within this region, and any data point within this area is considered to be not statistically significant enough to warrant rejecting the null hypothesis at the 5% significance level.
What is the relationship between the sample size and the critical T value at the 95% confidence level?
-The critical T value at the 95% confidence level is dependent on the sample size and the degrees of freedom. For small sample sizes, the critical T value is larger due to the increased uncertainty. As the sample size increases, the critical T value decreases, and for sample sizes greater than 20, it approximates the Z value of 1.96.
How can one determine the critical T value for a given sample size?
-The critical T value for a given sample size can be determined by looking up the value in a T-distribution table, which is often found in statistical textbooks. The table is organized by degrees of freedom (which is the sample size minus one) and provides the critical T value for different confidence levels, such as the 95% confidence level.
Outlines
📚 Introduction to the T Distribution and Z-Score
This paragraph introduces the T distribution, which is closely related to the Z-score. The historical context is provided by mentioning William Gossett, who used the T distribution in improving the quality of Guinness beer. The normal distribution is described with its acceptance and rejection areas, highlighting the two-tailed test concept where 95% of the data lies within the acceptance region and 5% in the rejection region, also known as the tails. The significance of the Z-scores (1.96 and -1.96) as the number of standard deviations from the mean is emphasized. The paragraph also explains the T distribution's appearance, comparing it to the normal distribution, noting that it's shorter and 'fatter.' The behavior of the T distribution with varying sample sizes is discussed, explaining how it approaches the normal distribution as sample size increases, particularly when the sample size exceeds 20.
🔍 T Distribution and Sample Size Relationship
The second paragraph delves into the relationship between the T distribution and sample size. It explains that as the sample size grows, the T distribution more closely resembles the normal distribution. Specifically, for sample sizes larger than 20, the T distribution and the normal distribution are effectively identical. The concept of degrees of freedom is introduced, defined as the sample size minus one, and its relevance to the critical value of the T distribution is discussed. The paragraph concludes by stating that for very large sample sizes (anything larger than 100), the critical value of the T distribution is 1.96, which is the same as that of the normal distribution.
Mindmap
Keywords
💡T distribution
💡Z-score
💡William Gossett
💡Normal distribution
💡Two-tailed test
💡Alpha
💡P-value
💡Degrees of freedom
💡Null hypothesis
💡Critical value
💡Sample size
Highlights
The T distribution was historically used by William Gossett to improve Guinness beer quality.
The T distribution is similar to the Z-score but is used when sample sizes are small.
The normal distribution curve is characterized by a 95% acceptance area and 5% rejection area, known as a two-tailed test.
The tails of the distribution are referred to as alpha, and in some contexts, as the p-value.
Z-scores of ±1.96 are used to define the critical region for rejecting the null hypothesis in a two-tailed test.
The T distribution is shorter and fatter compared to the normal distribution, adjusting for small sample sizes.
As sample size increases, the T distribution becomes more like the normal distribution.
For large samples (greater than 20), the T distribution and the normal distribution are effectively the same.
The critical T score for a very small sample size (n=2) is ±12.7, indicating a wider range than the Z-score.
Degrees of freedom in statistics are calculated as the sample size minus one.
The critical value from the T distribution table approaches 1.96 as the sample size and degrees of freedom increase.
At sample sizes of 100 or more, the T distribution's critical value is 1.96, matching the Z-score.
The tutorial provides a visual comparison between the T distribution and the normal distribution.
The importance of remembering the Z-score value of 2 for easier application in statistical tests is emphasized.
The tutorial explains the concept of rejecting the null hypothesis based on T or Z scores falling outside the critical region.
The significance of the T distribution in statistical analysis, particularly for small sample sizes, is discussed.
The tutorial concludes by reinforcing that for sufficiently large sample sizes, the T and Z distributions provide similar results.
Transcripts
Browse More Related Video

01 - Hypothesis Testing For Means & Large Samples, Part 1
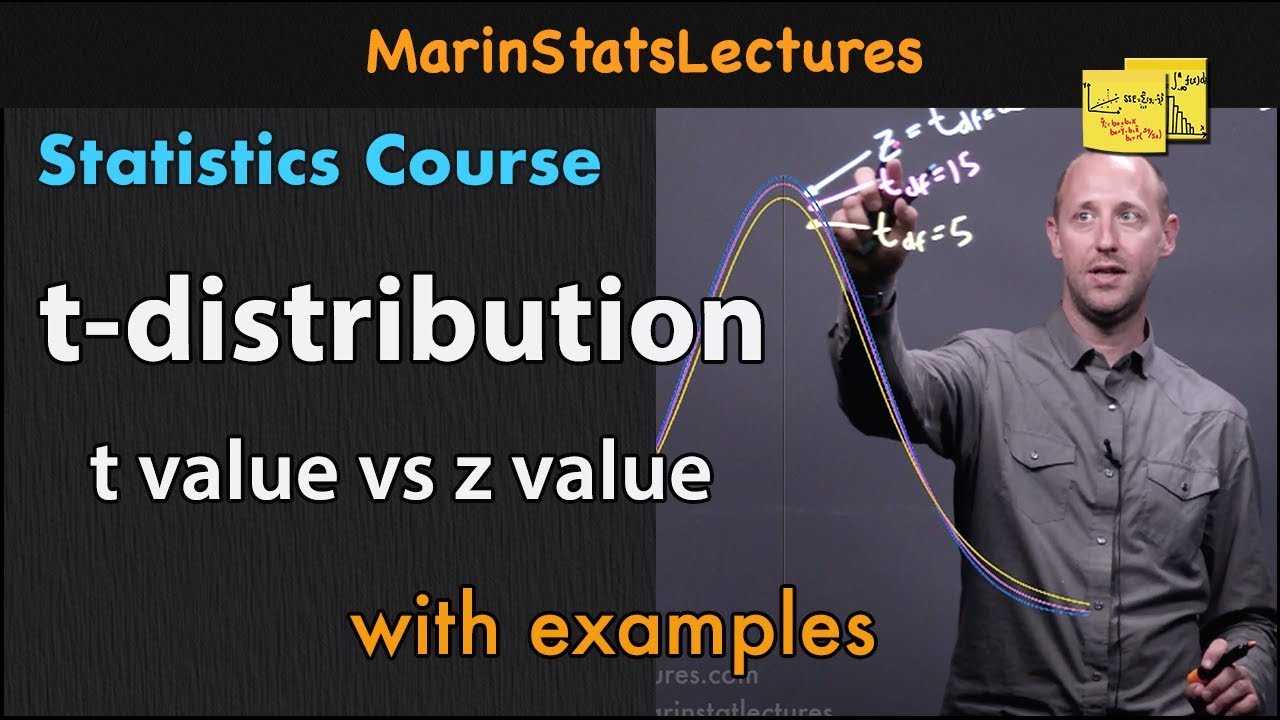
t-distribution in Statistics and Probability | Statistics Tutorial #9 | MarinStatsLectures
Student's T Distribution
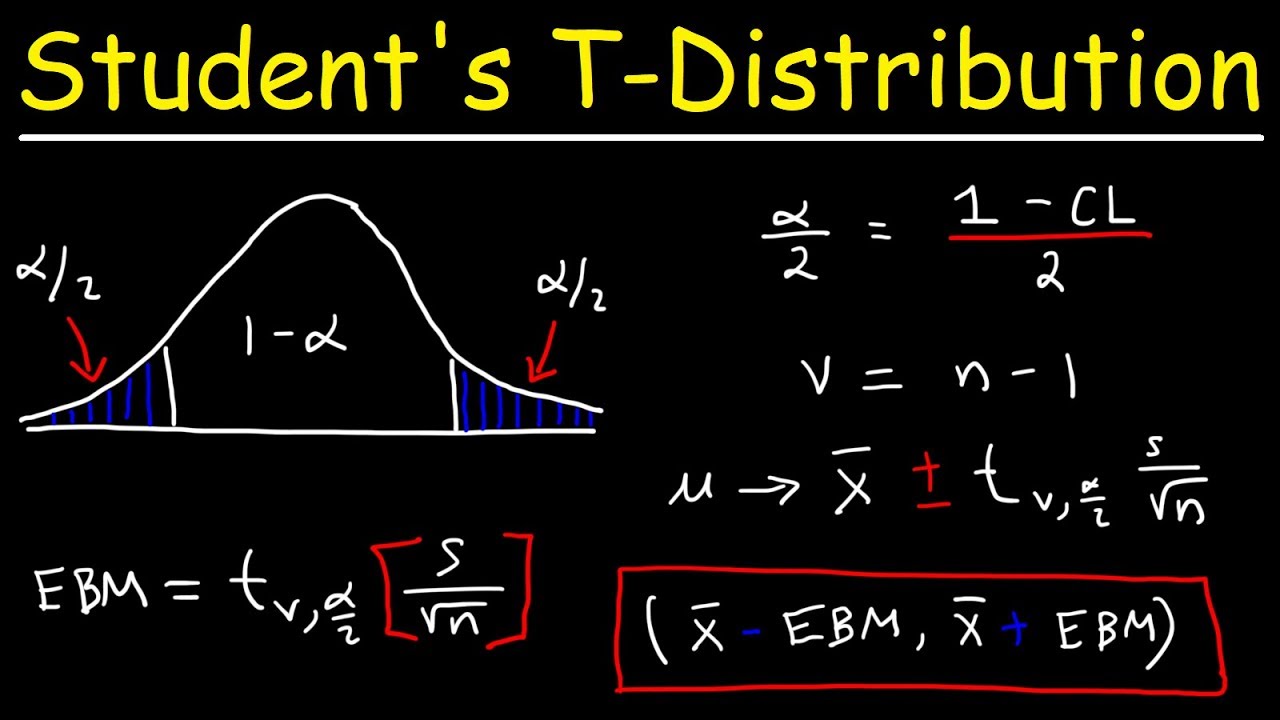
Student's T Distribution - Confidence Intervals & Margin of Error
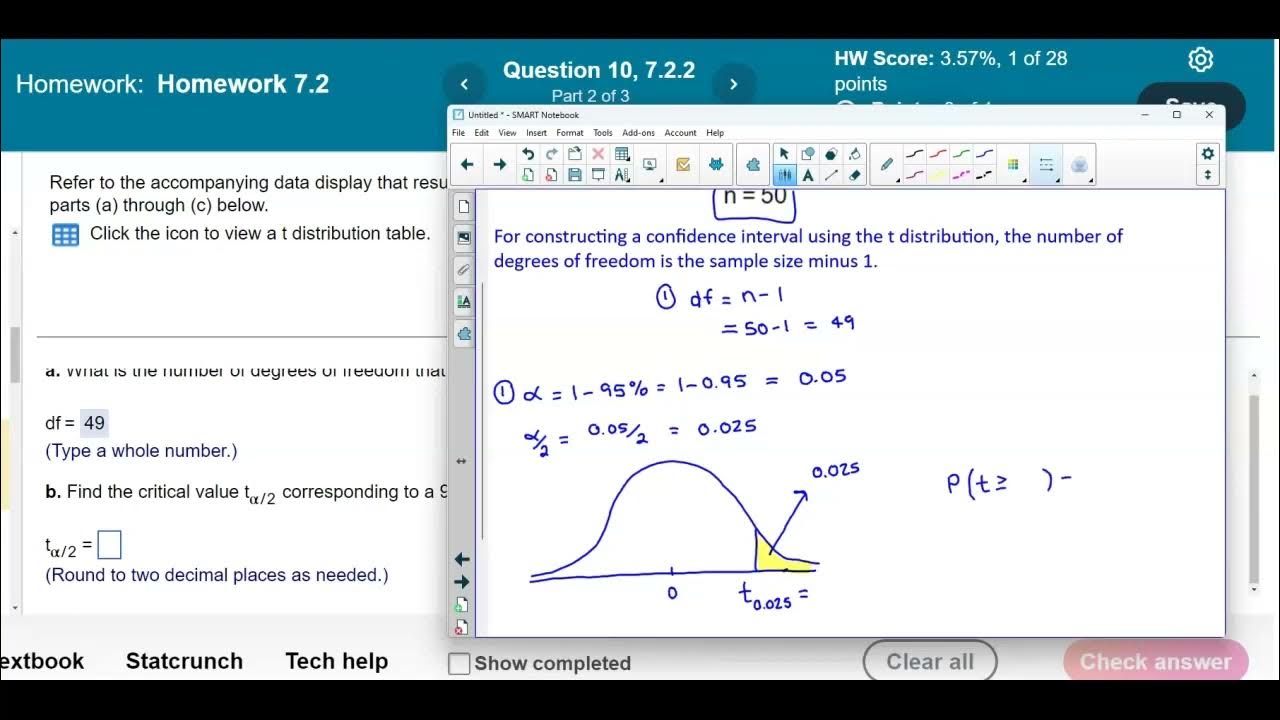
Math 14 HW 7.2.2 Find the degrees of freedom and critical t value.

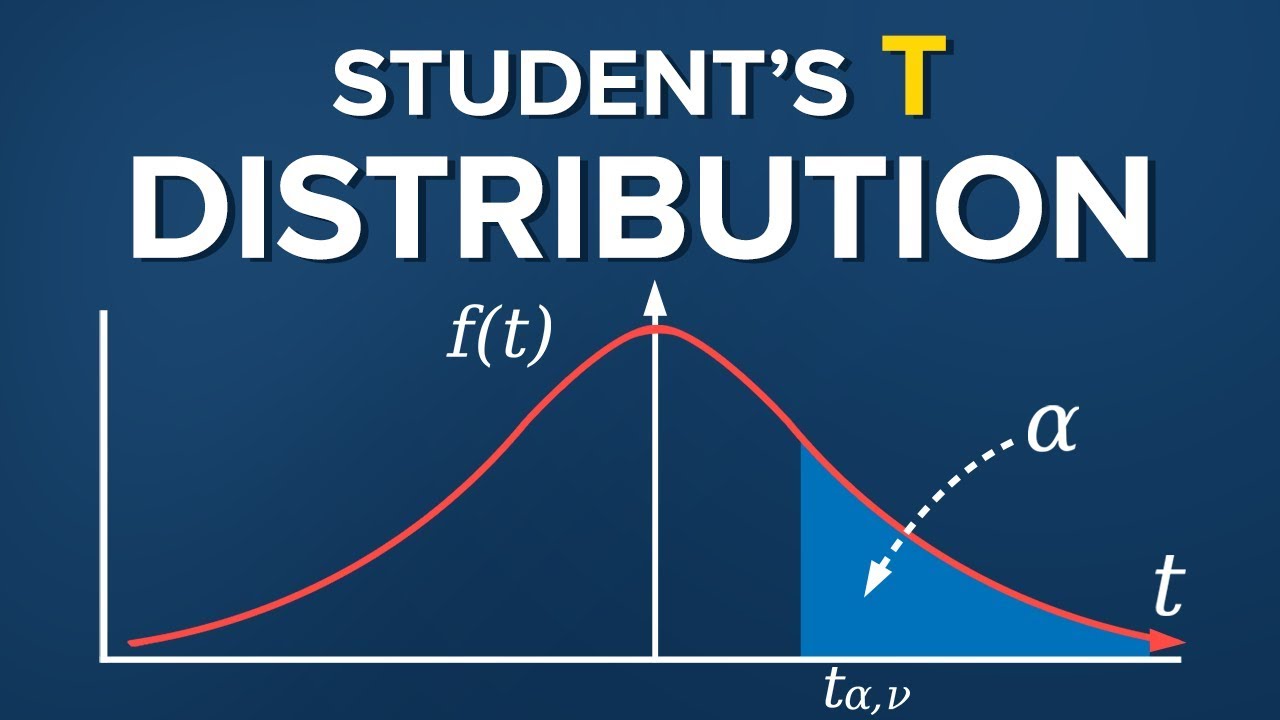
What is the t-distribution? An extensive guide!
5.0 / 5 (0 votes)
Thanks for rating: