Properties of Functions - Increasing vs Decreasing (Precalculus - College Algebra 9)
TLDRThe video script provides an in-depth explanation of the concepts of increasing and decreasing in the context of functions and their graphical representation. It clarifies that a function is considered increasing when, for any two points on the x-axis with the right point being larger, the corresponding y-values (outputs) also increase as you move from left to right. Conversely, a function is decreasing when the y-values decrease with increasing x-values. The importance of open intervals for these concepts is emphasized, as they allow for the continuous assessment of whether the function's output is growing or falling without endpoints that could disrupt the trend. The script also discusses how to identify intervals of increase and decrease by observing the graph's behavior as one moves along the x-axis. The explanation is practical, using hand movements to illustrate the process of identifying these intervals. The video concludes by setting the stage for future discussions on local or relative maxima and minima, and absolute maxima.
Takeaways
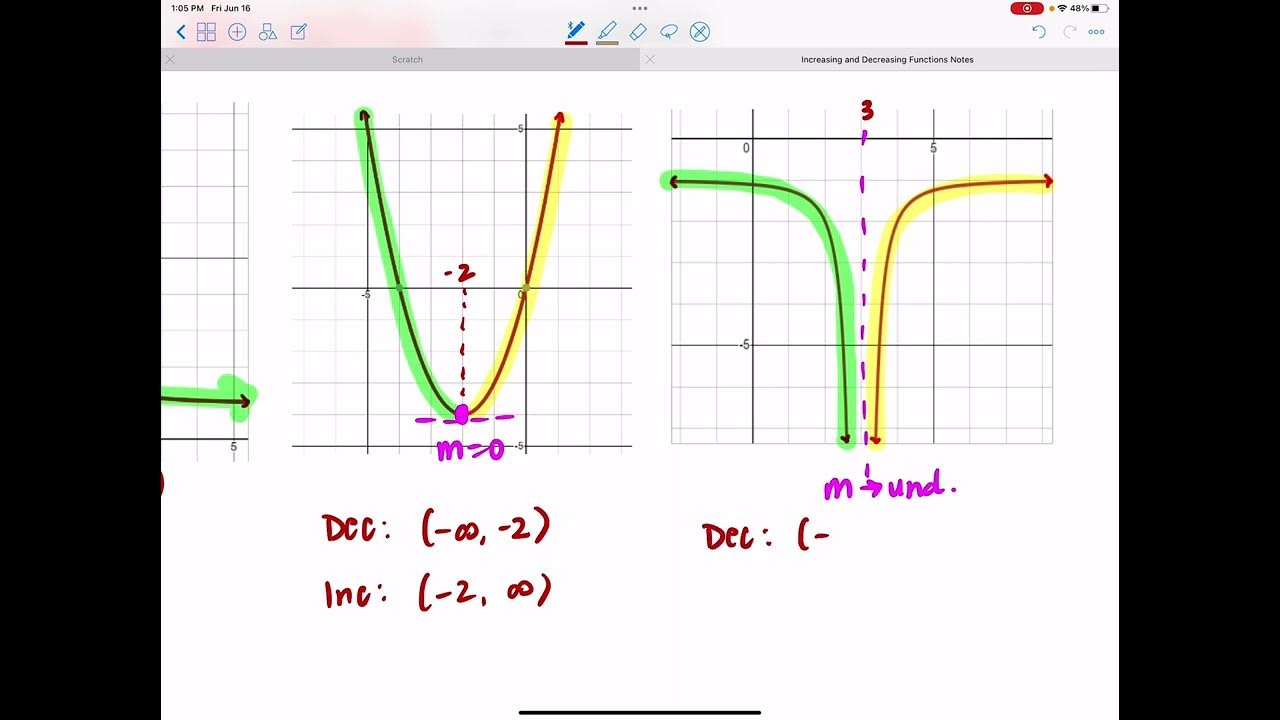
- 📈 **Increasing Function**: A function is said to be increasing when, as you move from left to right on the x-axis, the output of the function also gets larger.
- 📉 **Decreasing Function**: A function is decreasing when, as you move from left to right on the x-axis, the output of the function gets smaller.
- 🚫 **Open Intervals**: The concept of increasing or decreasing applies only to open intervals, never using brackets or equal signs, to allow for the possibility of continuous growth or decline.
- 🔄 **Local Maxima and Minima**: Changes from increasing to decreasing or vice versa indicate local maxima or minima, which are points where the graph changes direction from climbing to falling or falling to climbing.
- ➡️ **Direction of Analysis**: When determining if a function is increasing or decreasing, the analysis is done by looking from left to right on the x-axis.
- 🔍 **Graph Tracing**: To identify intervals of increase or decrease, one can trace the graph with one hand while marking intervals on the x-axis with the other.
- 🌄 **Climbing Graph**: An interval of the x-axis where the graph is climbing as you move left to right is considered an interval of increase.
- 🌌 **Falling Graph**: An interval of the x-axis where the graph is falling as you move left to right is considered an interval of decrease.
- 📐 **Interval Notation**: Intervals are represented using interval notation, which is a mathematical way to describe a set of numbers on the x-axis.
- 🚧 **Endpoint Consideration**: At endpoints of an interval, the function is neither increasing nor decreasing; it's a local maximum or minimum, which will be discussed further in subsequent videos.
- ♾️ **Infinity Consideration**: When a graph extends to negative or positive infinity, the interval of decrease or increase continues to that point without end.
Q & A
What does it mean for a function to be increasing?
-A function is increasing when, for any two points on the x-axis with the second point to the right of the first, the output values of the function also increase as you move from left to right.
What is the significance of using open intervals for increasing and decreasing functions?
-Open intervals are used to denote that the function's behavior (either increasing or decreasing) is expected to continue indefinitely in that direction without an endpoint, which is not the case with closed intervals that imply a definite end to the behavior.
What happens at a point where a function changes from increasing to decreasing?
-At the point where a function transitions from increasing to decreasing, there is typically a local maximum, which is a peak in the graph of the function.
What is the opposite behavior of an increasing function?
-The opposite behavior of an increasing function is a decreasing function, where the output values of the function get smaller as you move from left to right on the x-axis.
Why can't you use brackets or equal signs with increasing and decreasing?
-Brackets or equal signs imply a specific value or endpoint, which contradicts the concept of increasing or decreasing functions that require the potential for continuous change without a definitive stopping point.
How do you identify intervals of increasing on a graph?
-You identify intervals of increasing by looking at the x-axis and noting the sections where, as you move from left to right, the graph of the function is rising or climbing.
What is a local maximum in the context of a function's graph?
-A local maximum is a point on the graph of a function where there is a change from increasing to decreasing behavior in a neighborhood around that point, forming a peak.
What is the difference between a local maximum and an absolute maximum?
-A local maximum is a point where the function's graph has a peak in a certain neighborhood, whereas an absolute maximum is the highest point of the function over its entire domain.
How do you determine if a function is neither increasing nor decreasing at a specific point?
-At a specific point, if the function's graph neither rises when moving to the right nor falls, it is considered a local minimum or a local maximum, depending on the direction of change around that point.
What does it mean when a function's graph is horizontal for a time?
-When a function's graph is horizontal, it means that the function's output values are constant for a range of input values, indicating neither an increase nor a decrease over that interval.
How do you represent the intervals of a function that is always increasing or always decreasing?
-For a function that is always increasing or always decreasing, you represent the intervals as open intervals extending from negative infinity to a certain point for increasing, and from a certain point to positive infinity for decreasing.
Outlines
📈 Understanding Increasing and Decreasing Functions
This paragraph introduces the concepts of increasing and decreasing in the context of a function's graph. It explains that a function is increasing when, as you move along the x-axis from left to right, the output values also increase. Conversely, a function is decreasing when the output values diminish as you move along the x-axis. The importance of open intervals is emphasized, as they allow for the continuous assessment of whether the function's values are growing or falling. The paragraph also clarifies that these concepts apply to parts of the x-axis where the graph's behavior changes from climbing to falling or vice versa.
📉 Identifying Intervals of Increase and Decrease
The second paragraph delves into identifying specific intervals on the x-axis where a function's graph is increasing or decreasing. It illustrates the process of using open intervals to denote these sections, highlighting that at any given point within an interval, the function's output must either consistently increase (for increasing intervals) or decrease (for decreasing intervals). The paragraph also discusses how to visually trace the graph to determine these intervals and emphasizes that the concept of 'local maximum' or 'local minimum' will be covered in a subsequent video.
🔍 Analyzing the Behavior of a Function's Graph
This paragraph focuses on the practical application of identifying intervals of increase and decrease on a function's graph. It demonstrates how to trace the graph with one hand while marking intervals on the x-axis with the other. The explanation clarifies that intervals of increase are marked where the graph's values rise as you move from left to right, and intervals of decrease are where the graph's values fall. The concept of an open interval is reiterated, showing that these intervals never include endpoints to maintain the definition of continuous increase or decrease.
🔗 Continuity and the Absence of Decreasing Intervals
The final paragraph of the script addresses the continuity of a function's graph and the identification of intervals where the graph does not decrease. It points out that even when a graph appears to level off or slow its rate of increase, it is still considered to be in an interval of increase if it never actually falls. The paragraph reinforces the idea that the intervals of increase or decrease are determined solely by the behavior of the graph on the x-axis and that the upcoming video will discuss local and absolute maxima and minima.
Mindmap
Keywords
💡Increasing
💡Decreasing
💡Local Maximum
💡Local Minimum
💡Open Interval
💡Graph
💡Function
💡X-axis
💡Y-axis
💡Interval Notation
💡Extrema
Highlights
The concept of increasing and decreasing functions is introduced based on the change from increasing to decreasing or vice versa, which forms peaks or troughs on a graph.
A formal definition of when a function is increasing is provided, emphasizing the growth of the function's input and output as you move from left to right on the x-axis.
The practical method to identify an increasing function involves observing whether the output is larger as you move to the right on the x-axis for any given x-value.
Decreasing functions are defined as those where the output gets smaller as the x-values increase from left to right on the x-axis.
The importance of open intervals in defining increasing and decreasing is highlighted, as they allow for the continuous nature of growth or decline.
Brackets or equal signs are never used with increasing and decreasing because they imply a stop or end, which contradicts the concept of continuous change.
The concept of local maxima and minima is teased for the next video, where a change from increasing to decreasing or vice versa will be discussed in detail.
The use of interval notation is emphasized for identifying sections of the x-axis where the graph is climbing or falling.
The speaker demonstrates how to identify intervals of increasing by tracing the graph and marking sections on the x-axis where the graph climbs as read from left to right.
Intervals of decreasing are found by marking sections on the x-axis where the graph falls when read from left to right.
The concept of a local maximum is introduced as a point where the graph changes from increasing to decreasing, which will be elaborated in the next video.
The concept of a local minimum is introduced as a point where the graph changes from decreasing to increasing, which will also be discussed in the next video.
The necessity of open intervals for testing whether outputs are getting higher or smaller is explained, as closed intervals would halt the test at an endpoint.
The process of identifying intervals of increasing and decreasing is demonstrated with a practical example, showing how to trace the graph and mark intervals on the x-axis.
The importance of understanding that increasing and decreasing are properties of the x-axis intervals, not the graph itself, is emphasized.
The video concludes with a promise to discuss absolute maxima in the next installment, providing a preview of upcoming educational content.
Transcripts
Browse More Related Video
5.0 / 5 (0 votes)
Thanks for rating:


